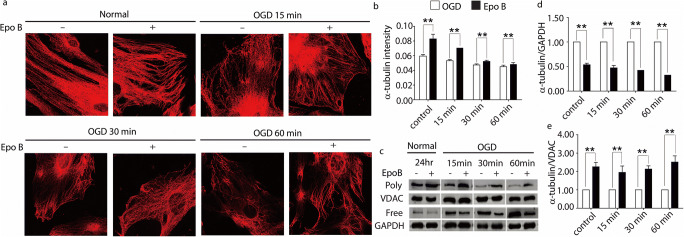
Fig. 1.
Epo B stabilizes microtubule of OGD conditioned endothelial cells. a Immunofluorescence staining of α-tubulin in endothelial cells. Scale bar 6 μm. b Statistical analysis of the fluorescence intensity of α-tubulin in endothelial cells. c Immunoblotting analysis of expression of free and polymerized tubulin in endothelial cells. d–e Statistical analysis of the relative intensity of free and polymerized tubulin in endothelial cells. The data represents the mean ± SD (n = 6). ** p < 0.01. Significance was determined by Student t tests.

