
Figure 9.
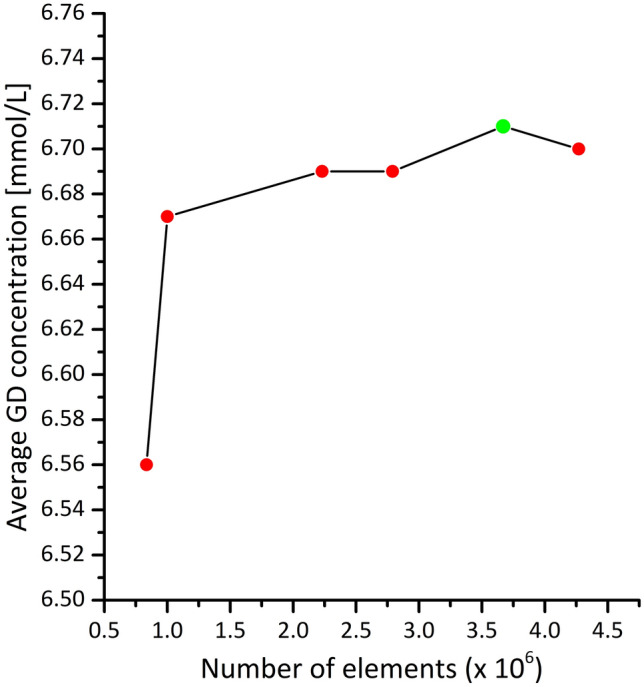
Sensitivity analysis performed on the grid of the CED model. The green marker indicates the number of elements for the mesh chosen for running all the simulations.
Official websites use .gov
A
.gov website belongs to an official
government organization in the United States.
Secure .gov websites use HTTPS
A lock (
) or https:// means you've safely
connected to the .gov website. Share sensitive
information only on official, secure websites.
Sensitivity analysis performed on the grid of the CED model. The green marker indicates the number of elements for the mesh chosen for running all the simulations.