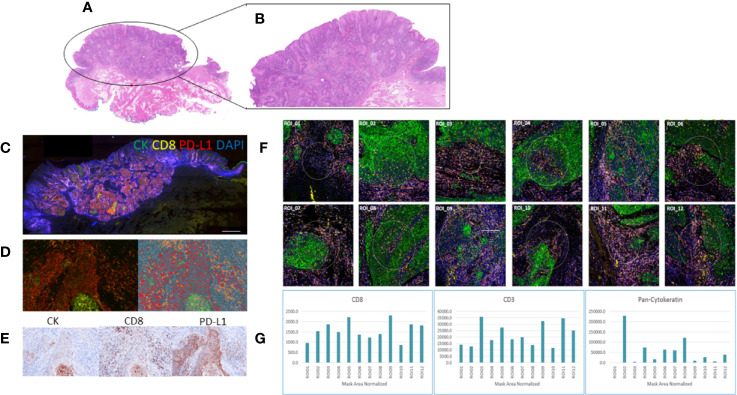
Figure 2.
Comparative staining across two multiplex technologies. (A) H&E stain of head and neck squamous cell carcinoma (HNSCC) tumor tissue; (B) highlighting the tumor region; (C) Opal four-color IHC staining (PerkinElmer) of the HNSCC tissue section for cytokeratin (green), CD8 (yellow), PD-L1 (red), DAPI (blue); (D) a tumor ROI imaged at 20x; (E) indicative brown stains of the individual channels for CK, CD8, and PD-L1; (F) whole slide imaged with visualization markers for ROI selection on the Nanostring GeoMx DSP 12 regions of interest (ROI) selection in multiple tumor regions; (G) barcode counts per ROI across the visualization markers CD8, CD3, and pan-cytokeratin.

