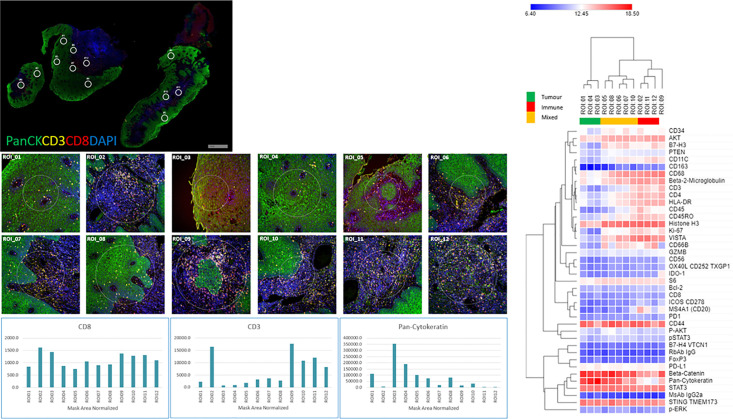
Figure 3.
Tissue morphology (NanoString GeoMX DSP) for HNSCC tumors with 12 regions of interests (ROIs) per section, visualization markers and heatmap per tissue section. HNSCC tissue was profiled using four-color fluorescence of CD8 (red), CD3 (yellow), PanCK (green), and DNA (blue). Twelve 200 µm diameter circular regions of interest (ROIs) were selected and further profiled with a 40-plex oligo-antibody cocktail (individual ROIs below the tumor staining and counts for CD3, CD8, and PanCK cells per ROI). Unsupervised hierarchical clustering heatmaps of region-specific (tumor – green, Immune- red, Infiltrating edge with a mixed cell population – yellow) nCounter digital counts across all protein targets.

