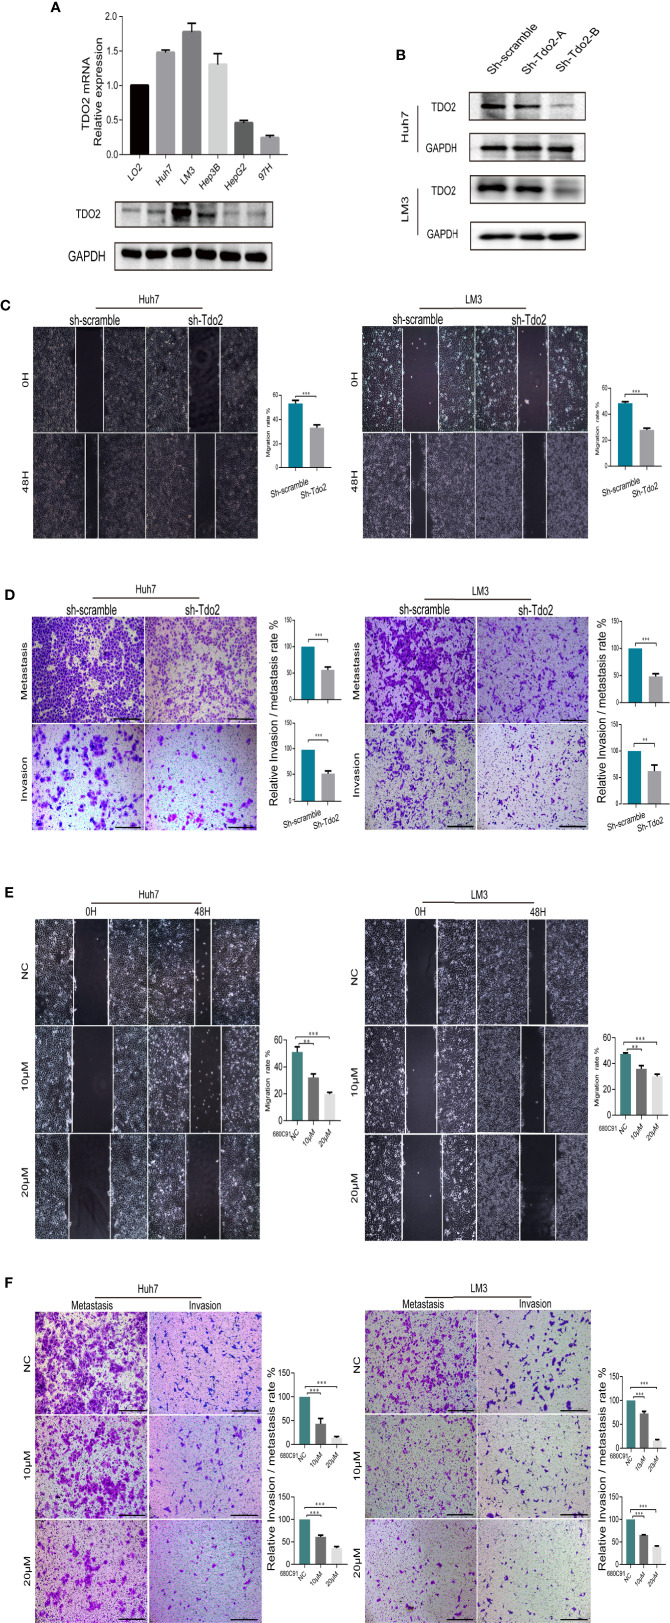
Figure 2.
TDO2 enhanced the metastasis of HCC cells in vitro and vivo. (A) Relative expression of TDO2 in HCC cell lines compared to normal liver cell LO2, as shown by qRT-PCR and Western Blot. (B) Establishment of TDO2 knockdown cell lines in Huh7 and LM3 cells, confirmed by Western Blot. (C) Representative data from Scratch wound assays performed with sh-Tdo2 and sh-scramble groups in Huh7 and LM3 cells. The migration distance, that is the difference between the width of wound at 0 h and that at 48 h measured using Adobe illustrator software, was recorded, and the migration rate, namely the ratio of migration distance to the initial wound width, was calculated. (D) Representative data from Transwell migration and Matrigel invasion assays with indicated cells. (E) Representative data from Scratch wound assays performed with the Huh7 and LM3 cell lines treated with TDO2 inhibitor 680C91 at different concentration. (F) Representative data from Transwell migration and Matrigel invasion assays with Huh7 and LM3 cells treated with TDO2 inhibitor 680C91 at different concentration. All data were recorded as means ± SEM of three independent experiments. Scale bar = 200 μm. **P < 0.01; ***P < 0.001.

