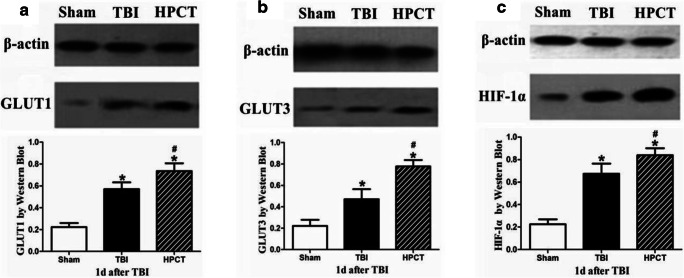
Fig. 7.
Expression of the GLUT1, GLUT3, and HIF-1α proteins in the pericontusional cortex. Electrophoretic band photographs of the western blot analysis of GLUT1, GLUT3, HIF-1α, and β-actin proteins in the cortex. As shown in the graphs, TBI caused an increase in protein expression of GLUT1 (A), GLUT3 (B), and HIF-1α (C) compared with those in the sham group (n = 6 animals per group,*p < 0.05), and HPC increased the expressions of GLUT1 (A), GLUT3 (B), and HIF-1α (C) proteins after TBI. Data are expressed as means ± SD (n = 6 animals per group, #p < 0.05)

