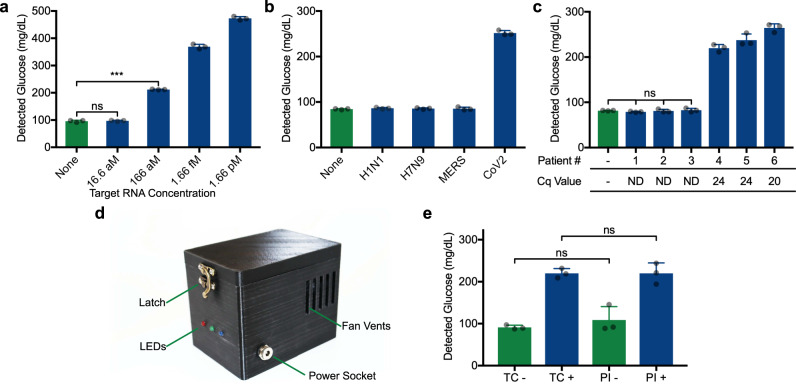
Fig. 5. Demonstration of the SARS-CoV-2 gene N sensor coupled to glucose meter detection.
a Assay sensitivity (using N3 B toehold switch) demonstrated with purified viral RNA. The concentration indicated reflects the viral RNA concentration of the 1 µL aliquot added to NASBA reactions prior to glucose generation. ***p = 0.0001. b The SARS-CoV-2 gene N sensor (N3 B) specificity was tested using viral RNA genomes isolated from influenza A subtypes H1N1 and H7N9, MERS and SARS-CoV-2 using an initial RNA concentration of 1.66 pM. c Sensor N3 B performance upon exposure to RNA extracted from 6 different patient samples (3 SARS-CoV-2 positive and 3 negative patients) assayed with glucose-based sensor. Switch DNA template present at 1.25 ng/µL. Neg: no RNA sample added to NASBA. Cq values from the parallel RT-qPCR assay of these sample listed on the x-axis. ND: not detected. d Companion portable incubator. This device is capable of facilitating the experiment in place of a thermocycler. e Using sensor N3 B, direct comparison between the thermocycler (TC) and portable incubator (PI). SARS-CoV-2 RNA was added to positive (+) reactions at 1.66 pM. For c, statistical analysis is one-way ANOVA. a and b are comprised of 3 technical replicates, representative of 3 independent experiments. e is comprised of 3 biological replicates. ns: not significantly different. Data are presented as mean values ± SD. Source data are provided as a Source Data file.

