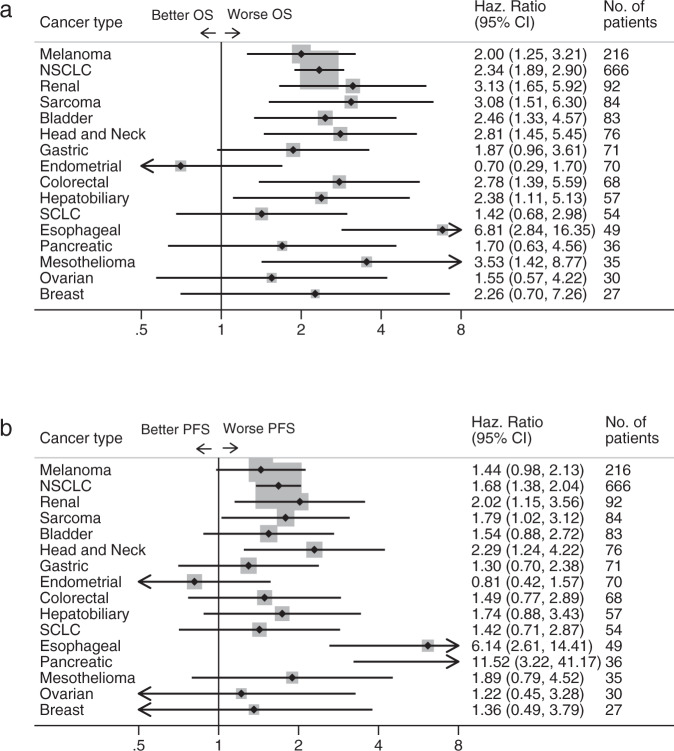
Fig. 2. Outcomes based on neutrophil-to-lymphocyte ratio (NLR) stratified by cancer type.
Forest plots showing hazard ratios (HRs) with 95% CIs for a overall survival and b progression-free survival across cancer types, comparing top 20th NLR percentile within each cancer type to bottom 80th. HRs were calculated with Cox proportional hazard regression. Abreviations: OS, overall survival; Haz. Ratio, hazard ratio; CI, confidence interval; NSCLC, non-small cell lung cancer; SCLC, small cell lung cancer; PFS, progression-free survival.

