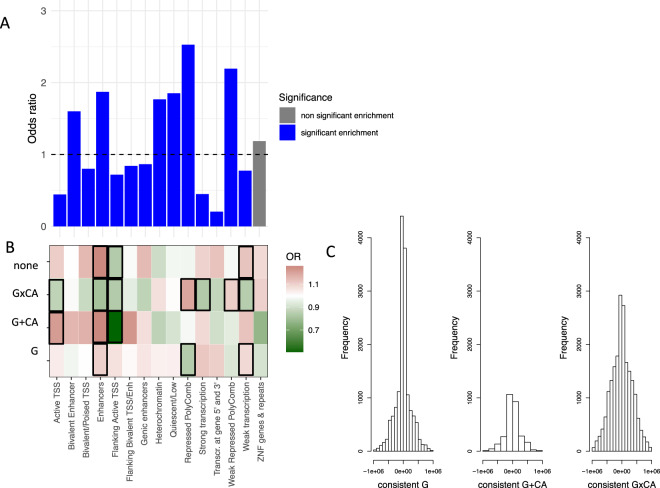
Fig. 2. Enrichment of overlapping VMPs with regard to ChromHMM states.
Histone mark enrichment for overlapping VMPs with regard to other 450K CpG sites (above panel) (a). Histone mark enrichment for overlapping VMPs (below) with at least two consistent best G, G + CA, or G × CA models against overlapping VMPs with no consistent models. Green color indicates depletion, and red color indicates enrichment. Thick black lines around the rectangles indicate significant enrichment/depletion based on Fisher’s tests and a Bonferroni threshold of p < 4.66 × 10−04. VMPs with at least two consistent best G × CA models were enriched in repressed Polycomb (p = 5.48 × 10⁻¹⁹, OR = 1.19, Fisher’s test) (b). Average distance between SNP and CpG site for consistent best G (left), consistent best G + CA (middle), and consistent G × CA models (right). CpGs with at least two consistent G × CA models presented with a significantly longer distance between SNP and VMP than VMPs with other consistent models (mean absolute distance = 271.83 kb, p < 2.20 × 10⁻¹⁶, Wilcoxon’s test) (c).

