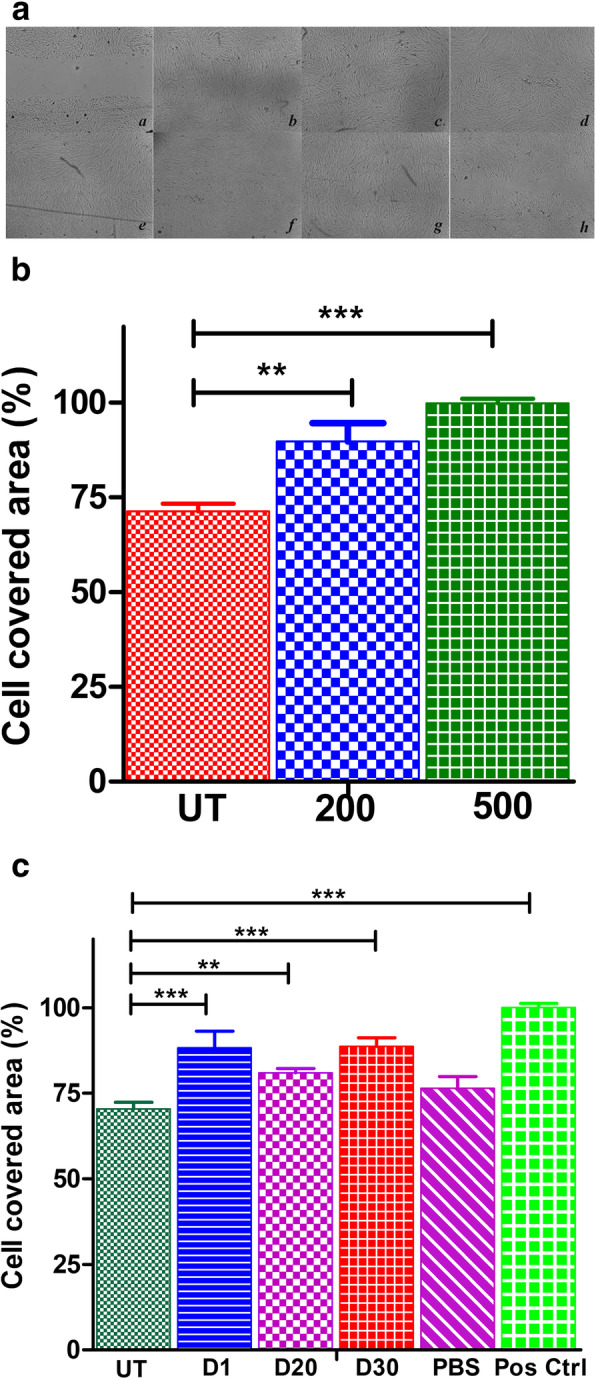
Fig. 3.

Effects of VEGF and VEGF-PLA on HESC migration: VEGF and VEGF-PLA stimulated HESC migration. HESC was grown to confluent and the monolayers were scratched with a pipette tip and stimulated with rVEGF121, 200 ng and 500 ng concentrations, and 1, 20, and 30 days’ release of VEGF-PLA; the cells were grown for 12 h and 24 h respectively. A Single picture representation of each group is shown; wound closure images was measured using Image J software. Images of the gap area induced at 12 h and 24 h: (a) untreated cells at 12 h; (b) 200 ng of rVEGF121 at 12 h; (c) 500 ng of rVEGF121 at 12 h; (d) positive control; (e) PLA–VEGF microparticles on day 1 at 24 h; (f) PLA–VEGF microparticles on day 20 at 24 h; (g) PLA–VEGF microparticles on day 30 at 24 h; (h) negative control. B The histogram showing the percentage of cell-covered area for different concentration of rVEGF121; asterisk indicates significant differences p < 0.001, p < 0.05. Cell covered percentage were compared with the untreated control (UT). Data represented (mean ± S.D., n = 3) at 12 h. Statistical significance shown is 200 ng and 500 ng of rVEGF121 vs. untreated group. C The histogram shows the percentage of cell-covered area at 24 h treated with rVEGF121-loaded microparticles (PLA-VEGF) collected on different days. Data represented as mean ± S.D., n = 3. Statistical significance (p < 0.001, p < 0.05) compared with the untreated control (UT)
