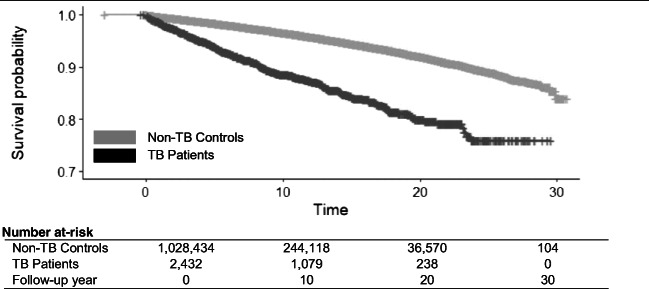
Fig. 2.
Kaplan-Meier survival curve calculated from date of TB treatment completion for TB patients and randomly selected reference date for non-TB controls: all non-TB causes of death among migrants to BC, Canada, 1985–2015. TB tuberculosis. Notes: time means person-years from TB treatment completion date (TB patients) or randomly selected reference date (non-TB controls) to event/censoring date

