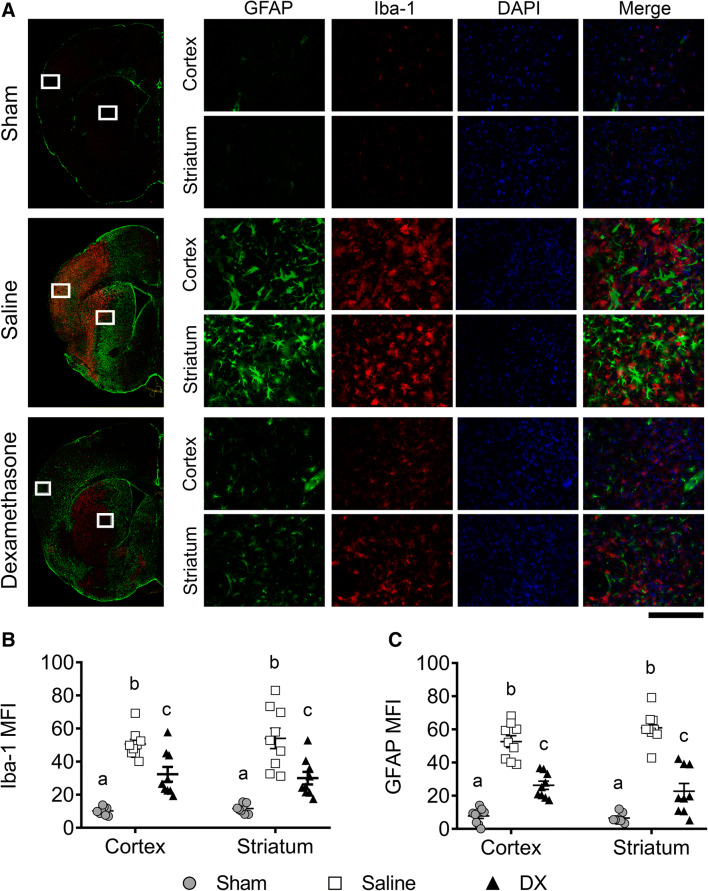
Fig. 6.
Analysis of brain GFAP (green) and Iba-1 (red) expression in treated and nontreated mice 7 days after the MCAO. Nuclei were stained with DAPI (blue). Representative mouse brain sections of the sham-, saline-, and dexamethasone (DX)-treated mice (A). Left images show a low-magnification reconstruction of the ipsilateral hemisphere. The mean fluorescence intensity (MFI) of Iba-1 (B) and GFAP (C) were quantified using the Image J software. Each point represents the data from 1 of 3 photographs analyzed in both the cortex and striatum (n = 3 animals per group). Data represent the mean ± SEM. Data were analyzed with 2-way ANOVA followed by Bonferroni’s test. Different letters (a, b, and c) indicate significant differences in the MFI between groups (p < 0.05). Scale bar, 200 μm

