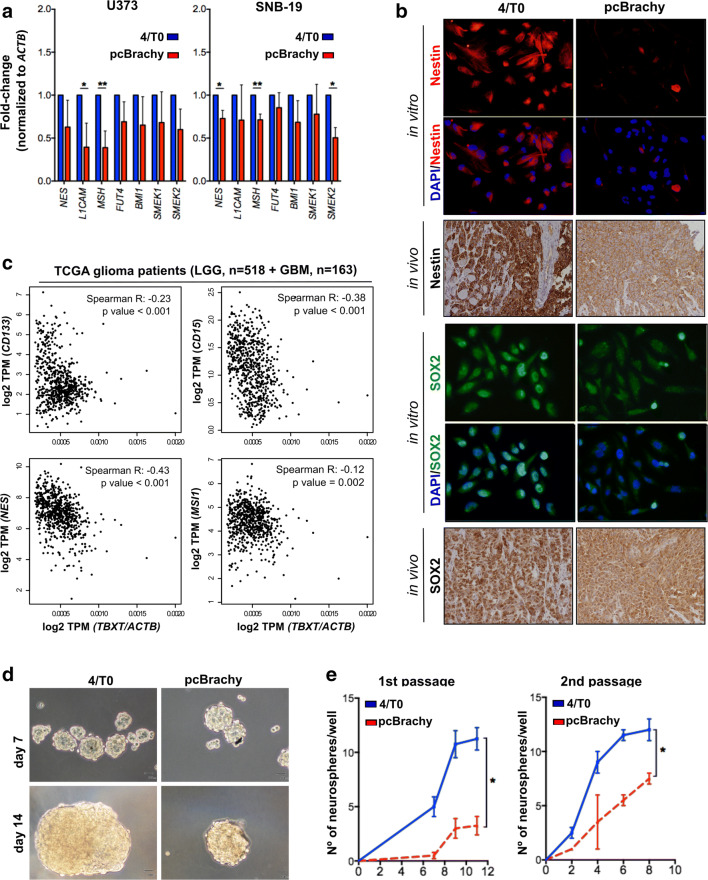
Fig. 3.
Brachyury is inversely correlated with glioma stem cell-like properties. Glioma cells with brachyury overexpression (pcBrachy) show lower expression of stem cell markers at both the mRNA (a) and protein levels (b). The same phenotype is observed in mouse tumors (b, in vivo) formed by glioma cells negative and positive for brachyury [27]. (c) Correlation analysis of stem cell markers (CD133, CD15, Nestin-NES, and Musashi-MSI1) in human glioma samples (TCGA, n = 681 gliomas) using the Gene Expression Profiling Interactive Analysis (GEPIA) program. (d) Representative images of the neurospheres formed by the U373 glioma cell line without (4/T0) or with brachyury (pcBrachy) expression. Magnification at × 20. (e) Quantification of the neurospheres formed by the self-renewal assay. In vitro data are presented as the means ± S.E.M. of at least three independent experiments. *p < 0.05, **p < 0.01, ***p < 0.001

