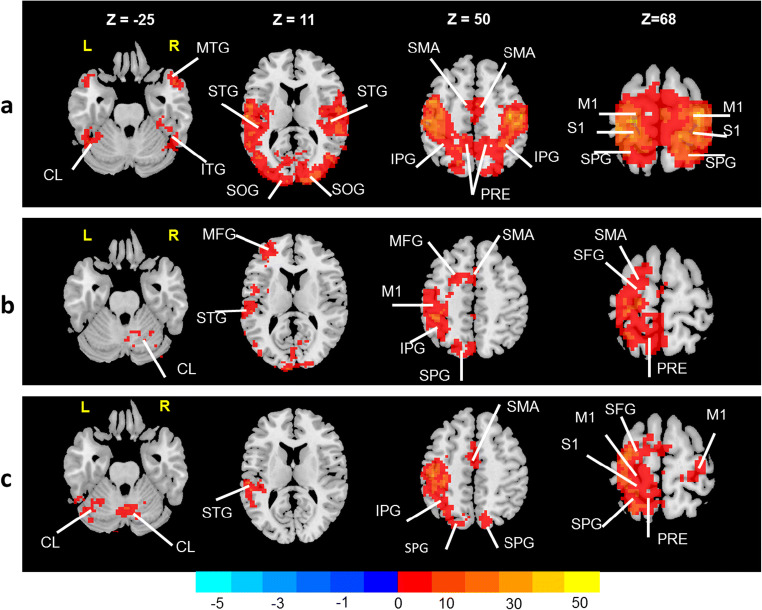
Fig. 2.
FC maps based on the one-sample t statistics at 4 representative transversal planes where MNI coordinates Z = − 25, 11, 50, 68, from the left to the right column. (a) The HCs’ FC maps associated with the dominant hemispheric M1 seed and the whole brain. (b, c) The FC maps of patients before and after intervention associated with the ipsilesional M1 seed and whole brain, respectively (p value < 0.001, cluster ≥50 voxels, GRF corrected). The cold color spectrum indicates significantly decreased FC maps in relation to M1 seed and the warm color spectrum indicates significantly increased FC maps in relation to M1 seed. Note: CL = cerebellum; ITG = inferior temporal gyrus; IPG = inferior parietal gyrus; PRE = precuneus; L = left; R = right; MTG = middle temporal gyrus; STG = superior temporal gyrus; SPG: superior parietal gyrus; S1: primary sensory cortex; M1: primary motor cortex; MFG: middle frontal gyrus; SFG: superior frontal gyrus; SMA: supplementary motor area; SOG: superior occipital gyrus

