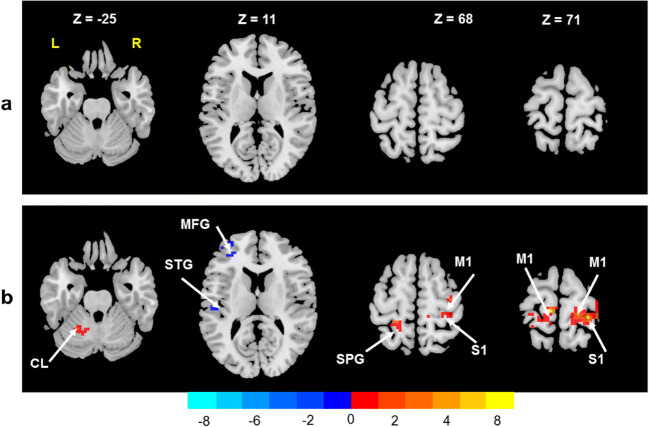
Fig. 3.
Post-treatment versus pre-treatment paired t statistics of the FC maps obtained from 4 representative transversal planes at MNI coordinates Z = − 25, 11, 68, and 71. (a) The FC maps GRF-corrected at p value greater than 0.001 and cluster ≥50 voxels. (b) The FC maps GRF-corrected at p value less than 0.01 and cluster ≥50 voxels. The cold color spectrum indicates significant negative changes of FC maps in relation to M1 seed between the before and after the intervention, and the warm color spectrum indicates significant positive changes of FC maps in relation to M1 seed between the before and after the intervention. Note: CL = cerebellum; L = left, R = right; STG = superior temporal gyrus; SPG = superior parietal gyrus; S1 = primary sensory cortex; M1 = primary motor cortex; MFG = middle frontal gyrus

