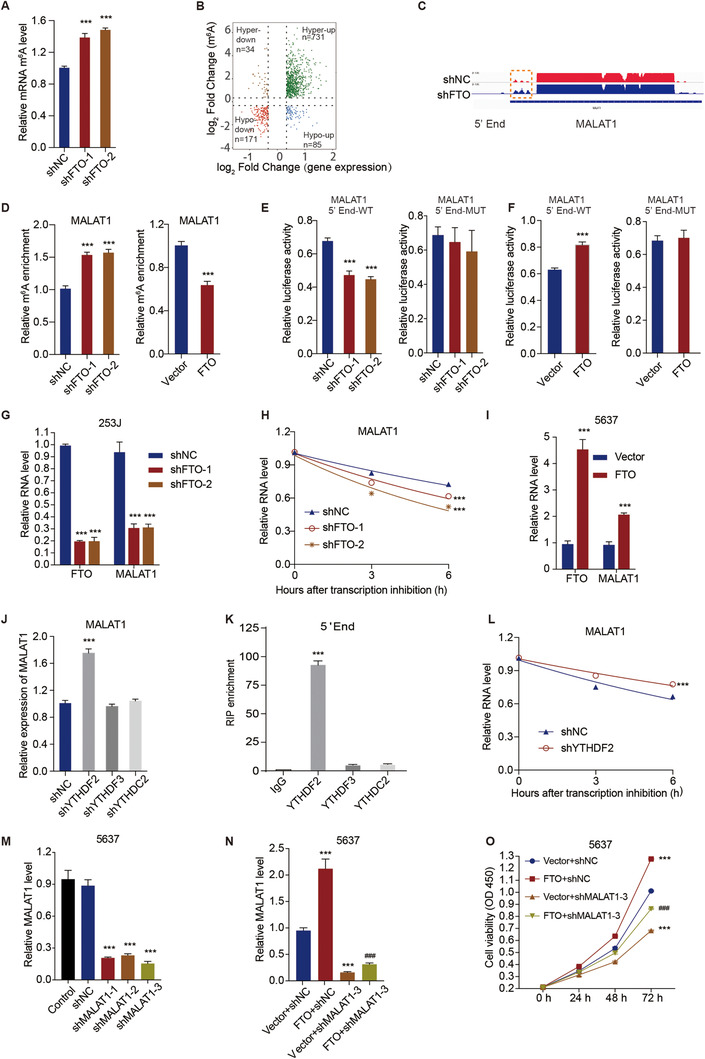
FIGURE 3.

FTO promotes cell viability of bladder cancer cells through regulation of MALAT1 mRNA m6A modification and stability. (A) The mRNA levels of global m6A in control and FTO‐knockdown 253J cells. (B) Volcano plots of the distinct m6A peaks (fold change ≥ 2 and p < 0.05). (C) The relative abundance of m6A sites along the MALAT1 mRNA in control and FTO‐knockdown 253J cells. The blue rectangles represent a decrease in the abundance of m6A peaks. (D) The relative m6A levels of MALAT1 5′‐end in FTO‐knockdown 253J cells (left panel) and FTO overexpression 5637 cells (right panel). (E and F) MALAT1 5′‐end enrichment in WT and mutated (MUT) 253J cells (E) and 5637 cells (F) transduced with the indicated constructs for FTO. (G) The relative mRNA levels of MALAT1 in FTO‐knockdown 253J cells. (H) The half‐life curve of MALAT1 transcription in FTO‐knockdown 253J cells. (I) The relative mRNA levels of MALAT1 in FTO overexpression 5637 cells. (J) The mRNA levels of MALAT1 in 253J cells transduced with the indicated constructs. (K) RNA immunoprecipitation of YTHDF2 and MALAT1 mRNA, with IgG as the control. (L) The half‐life curve of MALAT1 transcription in YTHDF2‐knockdown 253J cells. (M and N) The expression level of MALAT1 in 5637 cells transduced with the indicated constructs. (O) Viability of 5637 cells transduced with the indicated constructs. One‐way ANOVA (A, D‐left panel, E, J, K, M, N) and two‐way ANOVA (G‐I, L, O) followed by Bonferroni's post hoc test were used to perform comparisons of three or more groups. (D‐right panel, F) An unpaired t‐test was used to perform comparisons between two groups. ***p < 0.001 compared with shNC, Vector, IgG, or Vector+shNC. ###p < 0.001 compared with FTO+shNC
