FIGURE 2.

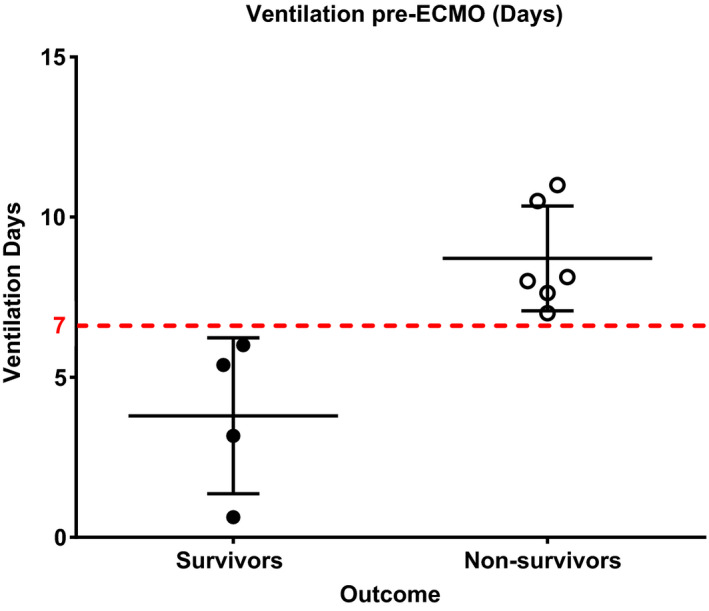
Scatter dot plot including mean and standard deviation of the number of pre‐ECMO ventilation time differences between survivors and non‐survivors

Scatter dot plot including mean and standard deviation of the number of pre‐ECMO ventilation time differences between survivors and non‐survivors