
Fig. 10.
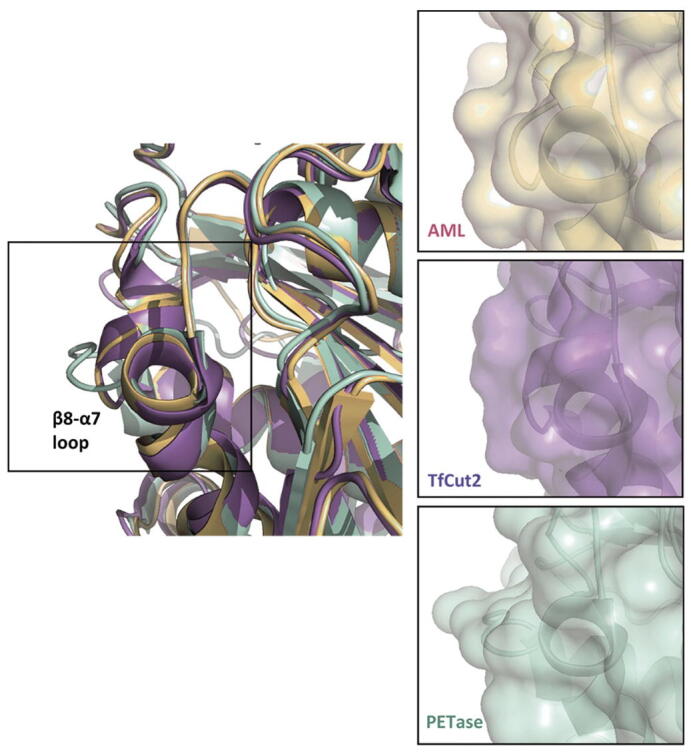
On the left, an overlay structural comparison of AML (mustard) with PETase (pale green; PDB ID: 5XH3; R103G/S131A mutant with 1-(2-hydroxyethyl) 4-methyl terephthalate (HEMT) bound as PET analogue) and TfCut2 (purple; PDB ID: 4CG1) – highlighting the β8-α7 loop region. On the right, are the separated protein surface plots of the same sites. The superposition was performed in PyMol using Cα atoms with default parameters. (For interpretation of the references to colour in this figure legend, the reader is referred to the web version of this article.)