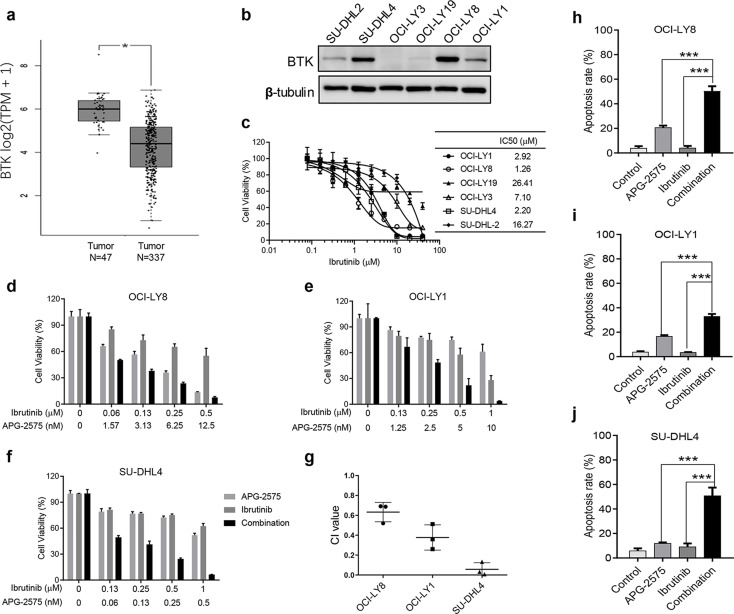
Figure 4.
BCL-2 inhibition combined with BTK blockade show synergistic antitumor effect. (a) BTK gene expression in DLBCL tissue and normal tissue; data obtained from the GEPIA (Gene Expression Profiling Interactive Analysis) database (http://gepia.cancer-pku.cn/). Statistical significance was determined by unpaired t-test. *p < 0.05. (b) BTK protein expression were measured by Western blot in DLBCL cell lines with β-tubulin as the loading control. (c) Cell viability detection for IC50 of DLBCL cell lines treated with BTK inhibitor ibrutinib for 48 h, relative to cells treated with DMSO (100%). The results represent the average and SD for at least three independent experiments. (d) Cell viability of OCI-LY8 cells after treatment with ibrutinib, APG-2575, or the combination at indicated concentrations for 48 h. (e) Cell viability of OCI-LY1 cells after treatment with ibrutinib, APG-2575, or the combination at indicated concentrations for 48 h. (f) Cell viability of SU-DHL4 cells after treatment with ibrutinib, APG-2575, or the combination at indicated concentrations for 48 h. (g) Combination index (CI) value of ibrutinib and APG-2575 combination in OCI-LY8, OCI-LY19, and SU-DHL4 cells. (h) OCI-LY8 cells were treated with DMSO, APG-2575 (10 nM), ibrutinib (1 μM), or combination of both agents for 24 h, and drug effect on apoptosis was determined by annexin V/PI staining and analyzed using flow cytometry. (i) OCI-LY1 cells were treated with DMSO, APG-2575 (10 nM), ibrutinib (1 μM), or combination of both agents for 24 h, and drug effect on apoptosis was determined by annexin V/PI staining and analyzed using flow cytometry. (j) SU-DHL4 cells were treated with DMSO, APG-2575 (50 nM), ibrutinib (1 μM), or the combination of both agents for 24 h, and drug effect on apoptosis was determined by annexin V/PI staining and analyzed using flow cytometry. The data are presented as the mean ± SD of triplicate experiments. For combination group compared to the single-agent group, unpaired t-test was used. ***p < 0.001. CI was calculated using CalcuSyn.

