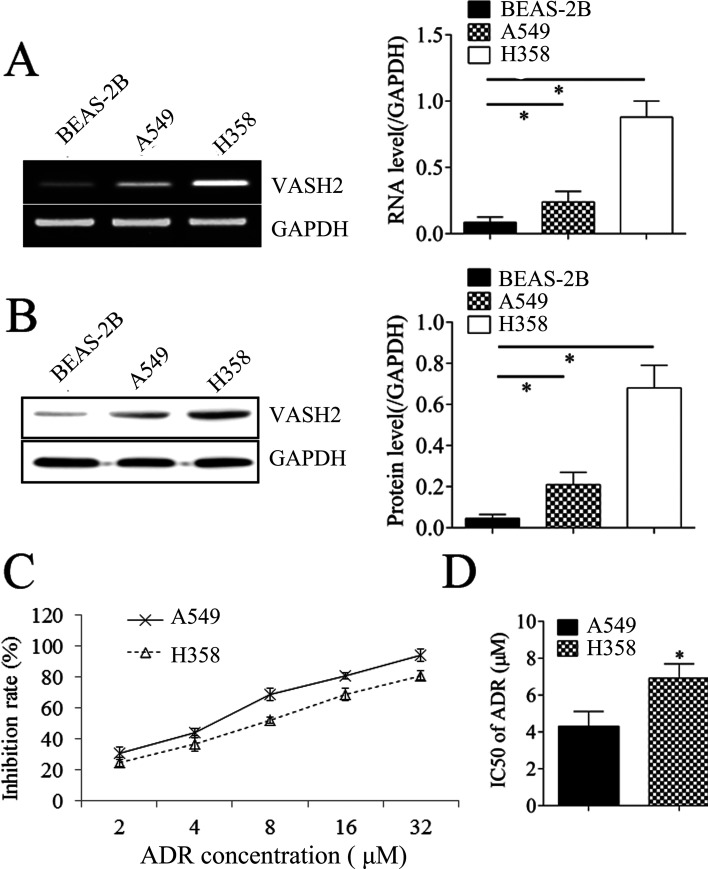
Figure 2.
The VASH2 expression in NSCLC cell lines. (A) RT-PCR was performed to measure the expression of VASH2 in NSCLC cell lines (A549 and H358) and the normal cell line BEAS-2B. (B) Western blot was performed to measure the expression of VASH2 in NSCLC cell lines (A549 and H358) and the normal cell line BEAS-2B. (C) MTT assay was performed to measure the inhibition rate in A549 and H358 cells after doxorubicin treatment (2, 4, 8, 16, or 32 μmol/L). (D) The half maximal inhibitory concentration (IC50) was calculated from (C). *p < 0.05.

