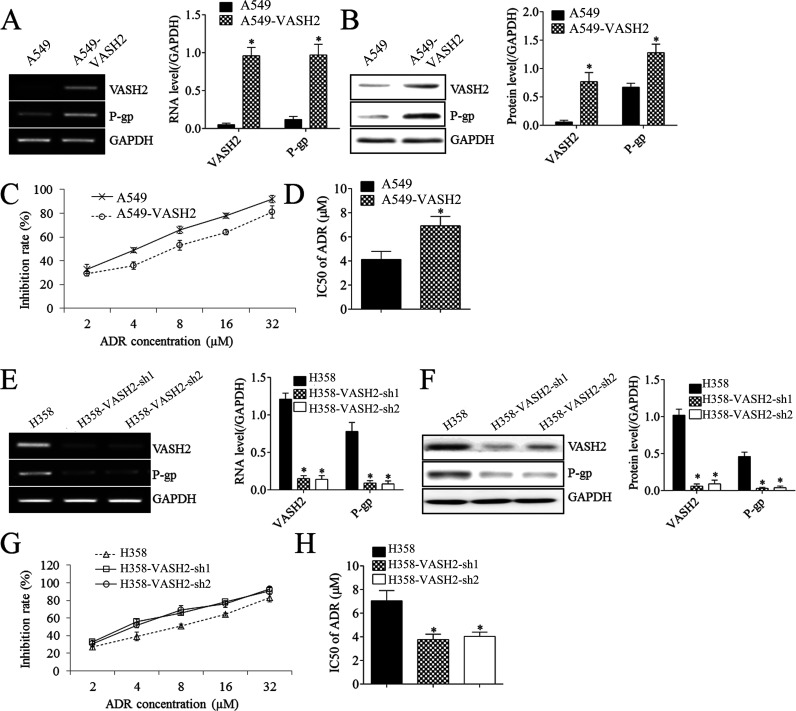
Figure 3.
The effects of VASH2 on cell proliferation and doxorubicin chemotherapy in A549 and H358 cells. (A) RT-PCR was performed to measure the expression of VASH2 and P-glycoprotein (P-gp) in A549 cells after VASH2 plasmid transfection. (B) Western blot was performed to measure the expression of VASH2 and P-gp in A549 cells after VASH2 plasmid transfection. (C) MTT assay was performed to measure the inhibition rate in A549 cells after VASH2 plasmid transfection under doxorubicin treatment (2, 4, 8, 16, or 32 μmol/L). (D) The IC50 was calculated from (C). (E) RT-PCR was performed to measure the expression of VASH2 and P-gp in H358 cells after VASH2 shRNA (sh-1, sh-2) transfection. (F) Western blot was performed to measure the expression of VASH2 and P-gp in H358 cells after VASH2 shRNA (sh-1, sh-2) transfection. (G) MTT assay was performed to measure the inhibition rate in H358 cells after VASH2 shRNA (sh-1, sh-2) transfection under doxorubicin treatment (2, 4, 8, 16, or 32 μmol/L). (H) The IC50 was calculated from (G). ADR, doxorubicin. *p < 0.05.

