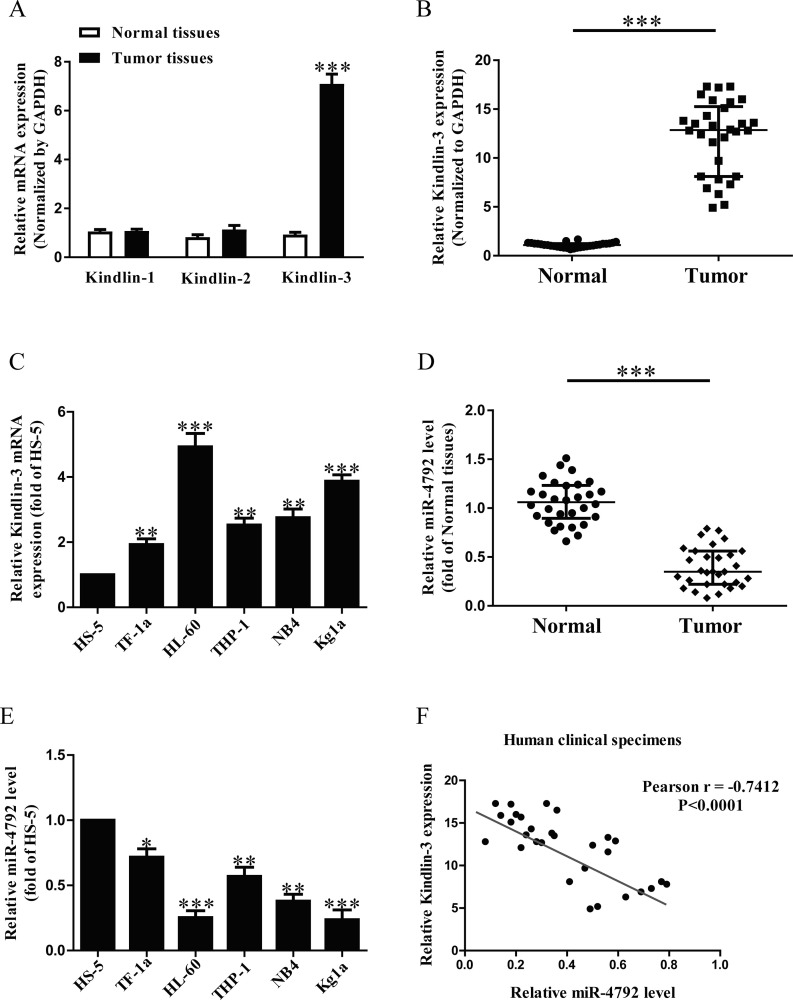
Figure 1.
The expressions of kindlin-3 and microRNA-4792 (miR-4792) in acute myeloid leukemia (AML) samples and cell lines. (A) Quantitative reverse transcription polymerase chain reaction (qRT-PCR) analysis of kindlin-1, kindlin-2, and kindlin-3 expressions in AML samples and adjacent normal samples (n = 6). Transcript levels were normalized by glyceraldehyde 3-phosphate dehydrogenase (GAPDH) expression. (B) qRT-PCR analysis of kindlin-3 expressions in AML samples and adjacent normal samples (n = 30). Transcript levels were normalized by GAPDH expression. (C) Relative kindlin-3 expression analyzed by qRT-PCR in five AML cell lines were normalized with GAPDH (n = 6). (D) qRT-PCR analysis of miR-4792 level in AML samples and adjacent normal samples (n = 30). Transcript levels were normalized by U6 level. (E) Relative miR-4792 level analyzed by qRT-PCR in five AML cell lines were normalized with U6 (n = 6). (F) Pearson’s correlation analysis of the relative expression levels of miR-4792 and the relative kindlin-3 mRNA levels in AML samples (n = 30). All data are presented as mean ± standard error of the mean (SEM). *p < 0.05, **p < 0.01, ***p < 0.001 versus normal samples or HS-5.

