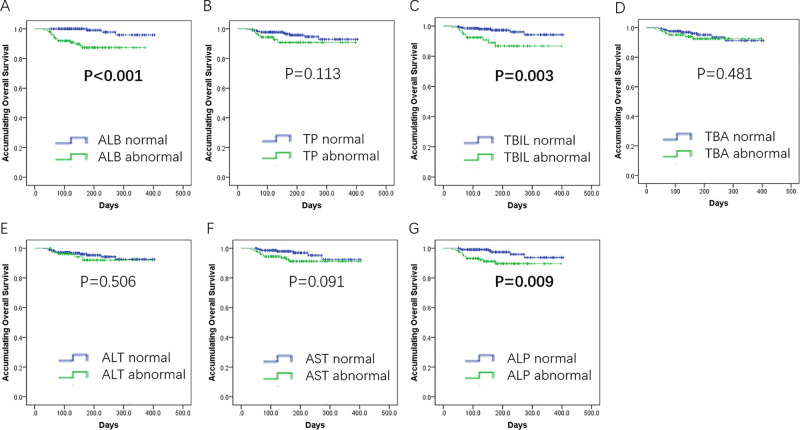
Figure 5.
Subgroup analysis of OS by baseline liver function indexes. Patients with albumin (ALB) abnormal (A), total bilirubin (TBIL) abnormal (C), or alanine aminotransferase (ALT) abnormal (G) were observed to have unfavorable OS. No difference was discovered between subgroups divided by other liver function indexes (B, D–F). Comparison of OS between/among groups was analyzed by K-M curves and log-rank test. A value of p < 0.05 was considered significant.

