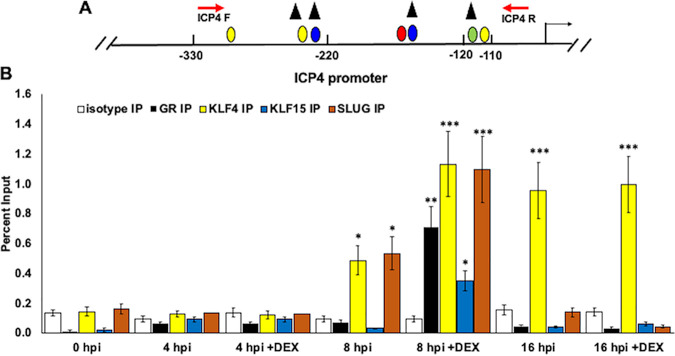
FIG 8.
Occupancy of GR, KLF4, KLF15, and SLUG with ICP4 enhancer sequences during productive infection. (A) Schematic of ICP4 promoter within the HSV-1 genome. Nucleotide positions are numbered relative to the transcription initiation site. ICP4 forward and reverse primer positions are denoted (red arrows), which result in a 247-bp PCR fragment. Positions of consensus transcription factor binding sites are the same as in Fig. 1. (B) Vero cells were cultured in MEM containing 2% charcoal-stripped FBS, following infection with HSV-1. Immediately following infection, cells were paraformaldehyde cross-linked and harvested for ChIP for the 0-h-after-infection time point. Samples treated with DEX (10 μM) were cultured in MEM containing 2% charcoal-stripped FBS. ChIP was performed as described in Materials and Methods using antibodies specific to IgG isotype (negative control, white columns), GR (black columns), KLF4 (yellow columns), KLF15 (blue columns), or SLUG (orange columns). Target DNA was amplified by PCR using ICP4 forward and reverse primers (A). Individual bands were quantified using Image Lab software and presented as a percentage of the input sample, which represents 13% of the harvested cell lysate for each sample. Data represent the means from three separate experiments with each antibody. Asterisks denote a significant difference between the protein-specific antibody and the respective isotype control (*, >0.05; **, >0.01; ***, >0.001). Student’s t test was performed to determine significance.

