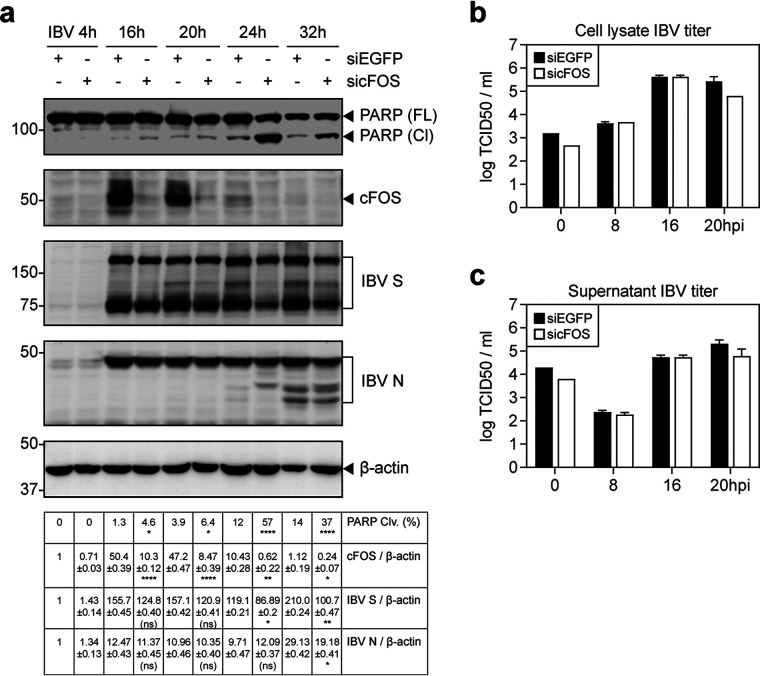
FIG 3.
Increased induction of apoptosis in cFOS knockdown cells infected with IBV. (a) H1299 cells were transfected with siEGFP and sicFOS before being infected with IBV at an MOI of ∼2. Cell lysates were harvested at the indicated time points and subjected to Western blot analysis using the indicated antibodies. Beta-tubulin was included as the loading control. Sizes of protein ladders in kilodaltons are indicated on the left. The percentage of PARP cleavage was determined as described in the legend of Fig. 2e. Significance levels are presented by the P value (ns, nonsignificant; *, P < 0.05; **, P < 0.01; ****, P < 0.0001). (b) H1299 cells were transfected and infected as described above for panel a, and cell lysates were harvested at the indicated time points by three freeze-thaw cycles. Virus titers were determined and are expressed in units of log TCID50 per milliliter. (c) Virus titers in the culture supernatants were determined and are expressed in units of log TCID50 per milliliter.

