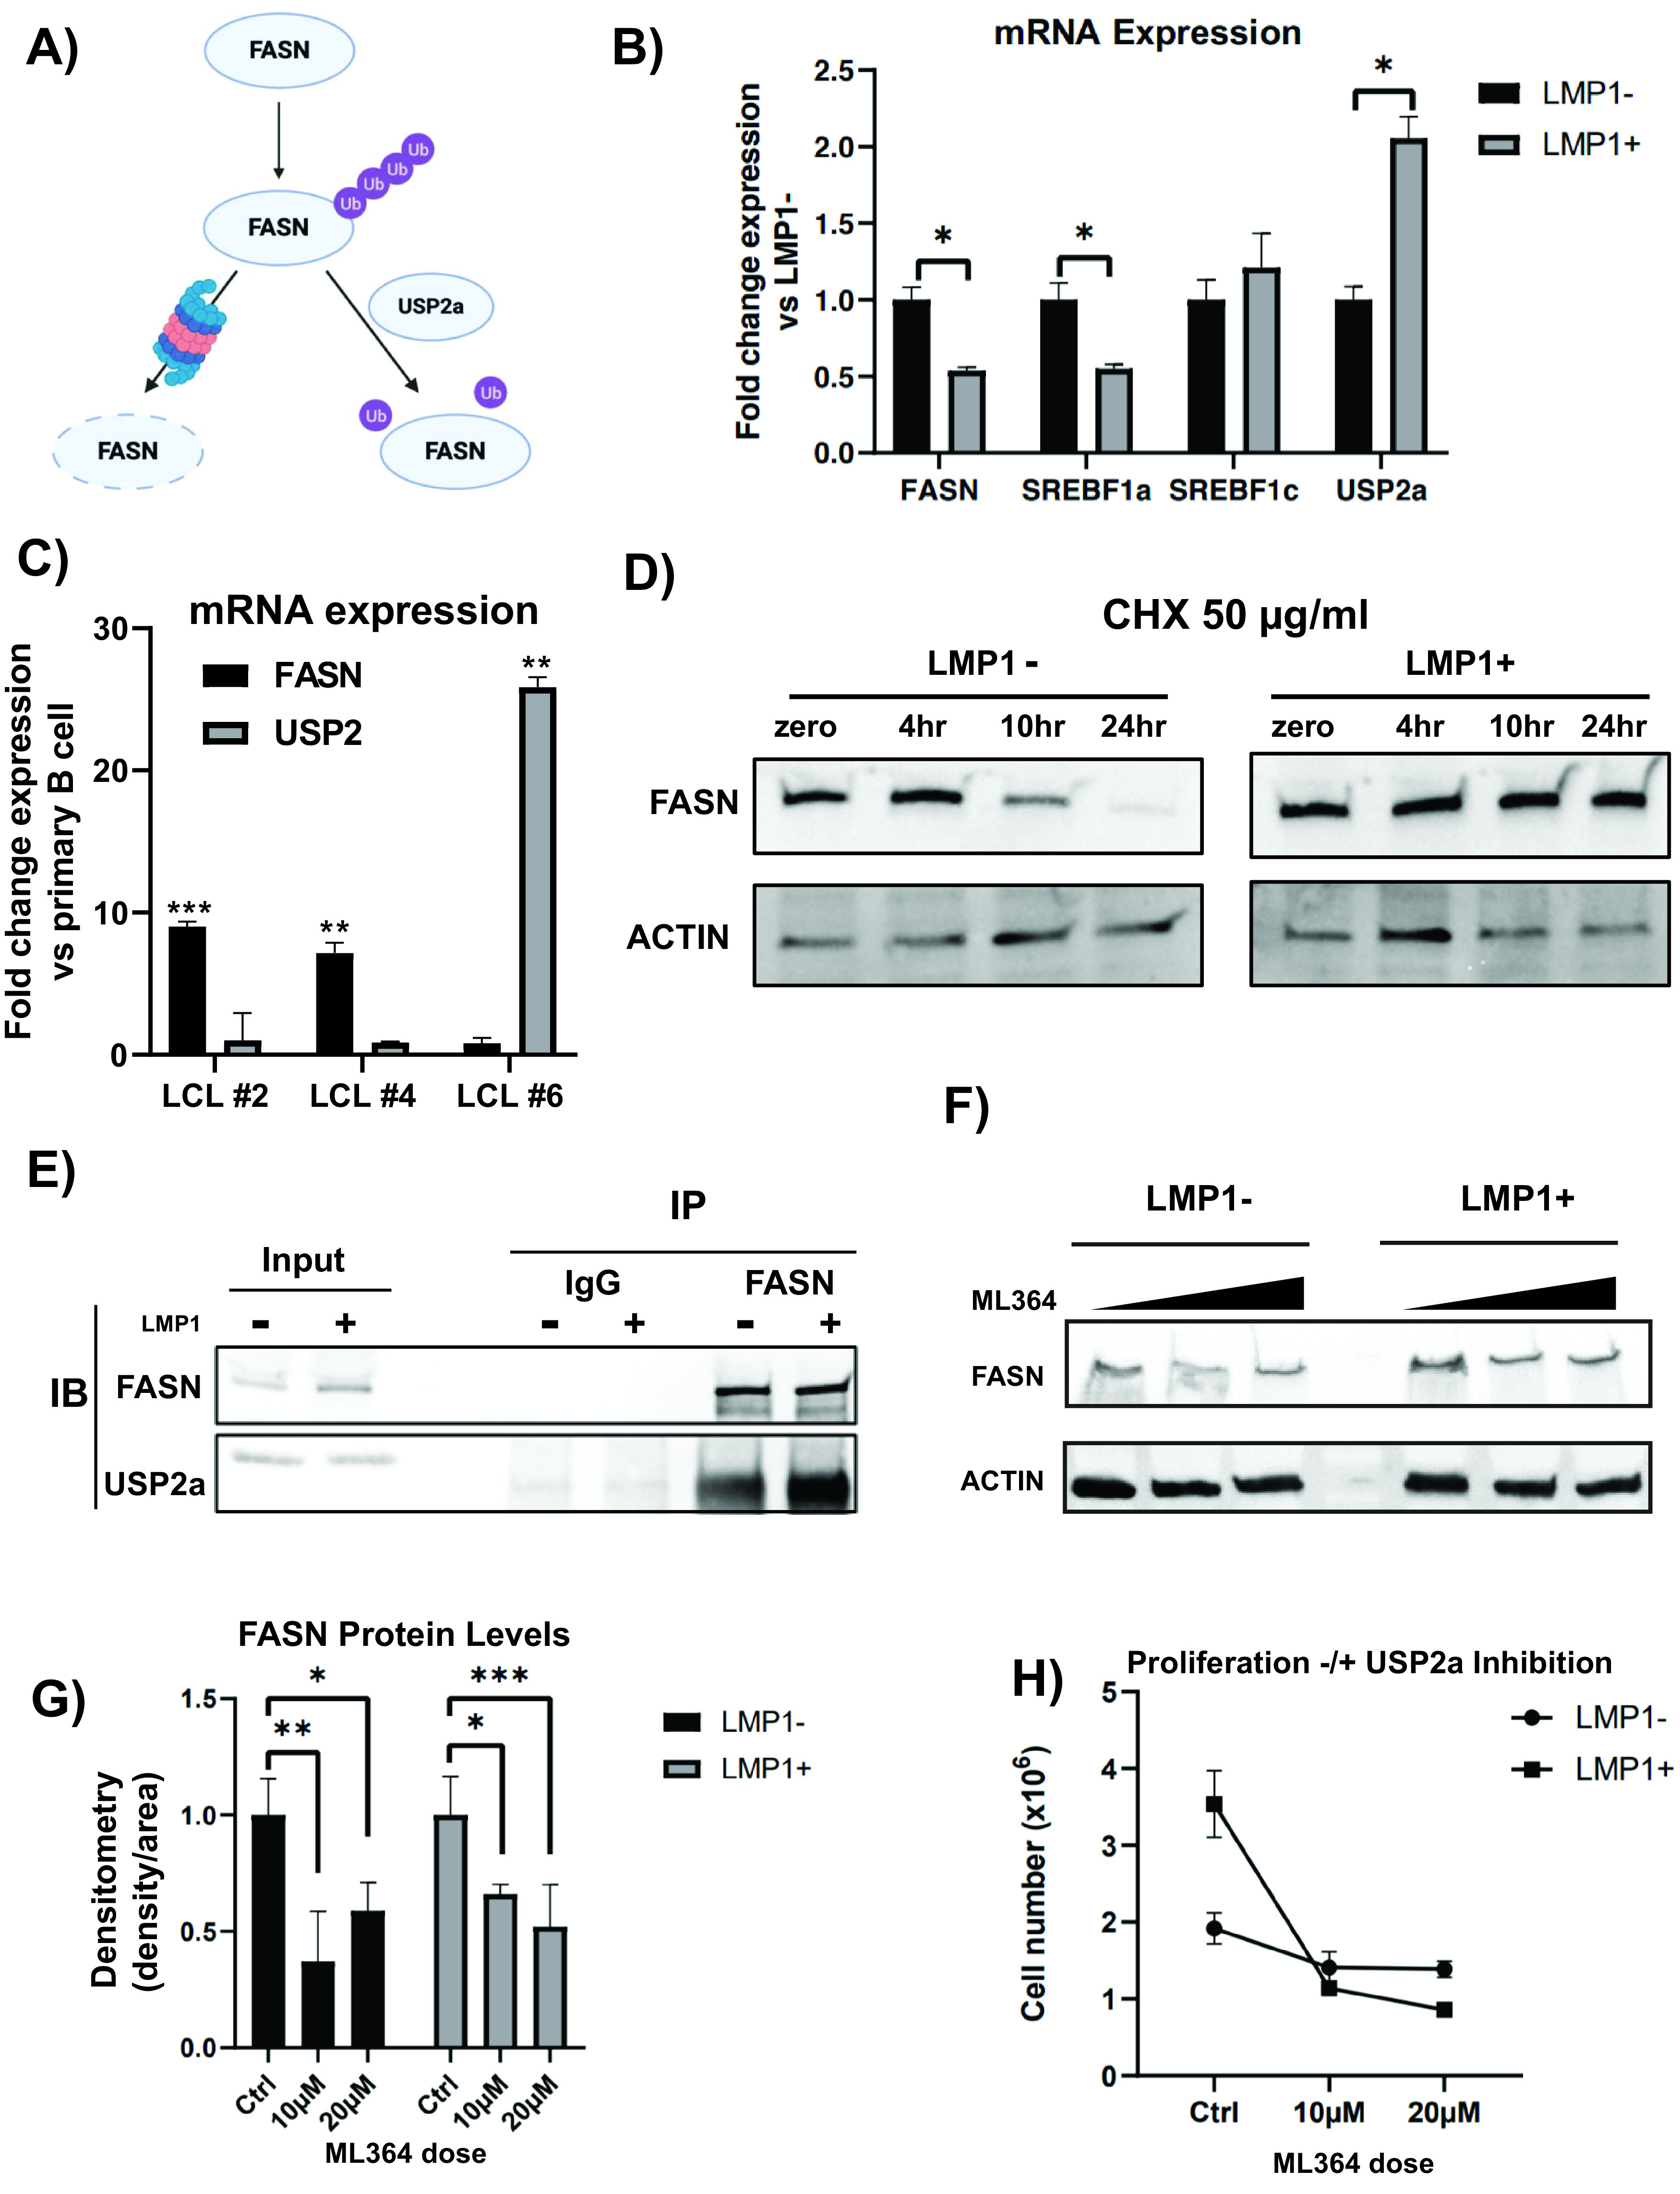
FIG 6.

LMP1 stabilizes FASN protein. (A) Schematic of FASN stabilization. USP2a, a ubiquitin-specific protease, functions by removing ubiquitin from FASN and, thus, prevents its degradation by the proteasome. (B) Relative mRNA expression in LMP1+ cells versus empty vector (pBABE) as determined by RT-qPCR using ΔΔCT analysis and normalized to 18s. (C) Relative mRNA expression in LCLs versus primary B cells (3 independent donors) as determined by RT-qPCR using ΔΔCT analysis and normalized to 18s. (D) FAS protein levels in LMP1− and LMP1+ cells treated with 50 µg/ml cycloheximide over a 24-h time course. Actin was included as a loading control. (E) Ten micrograms of polyclonal rabbit antibody to FASN or normal rabbit IgG was added to the lysate of 10 million LMP1− or LMP1+ DG75 cells, respectively. Magnetic protein A-conjugated beads were utilized to immunoprecipitate FASN/IgG binding proteins. Beads were boiled in 2× Laemmli buffer and run on a Western blot beside 10% protein lysate input and blotted for FASN and USP2a signal. IB, immunoblot. (F) Five million LMP1− and LMP1+ DG75 cells were treated with DMSO control (0 µM) or the USP2a inhibitor ML364 at 10 µM or 20 µM. Cell lysates were collected after 24 h and run on a Western blot. Blots were probed for FASN and actin as a control. The graph is representative of signal density/area of FASN, normalized to the actin control. DMSO control was set to 1, with treatment groups displayed as fold change relative to the DMSO control. (G) One million LMP1− or LMP1+ DG75 cells were treated with DMSO control, 10 µM ML364, or 20 µM ML364. At 24 h, cells were counted with trypan blue to exclude dead cells. Statistics of each treatment group compare the differences between proliferation rates with regard to LMP1 expression. Error bars represent standard deviations from three independent experiments. P values for significant differences (Student's t test) are summarized by four asterisks (P ≤ 0.0001), three asterisks (P < 0.001), two asterisks (P < 0.01), or one asterisk (P < 0.05).
