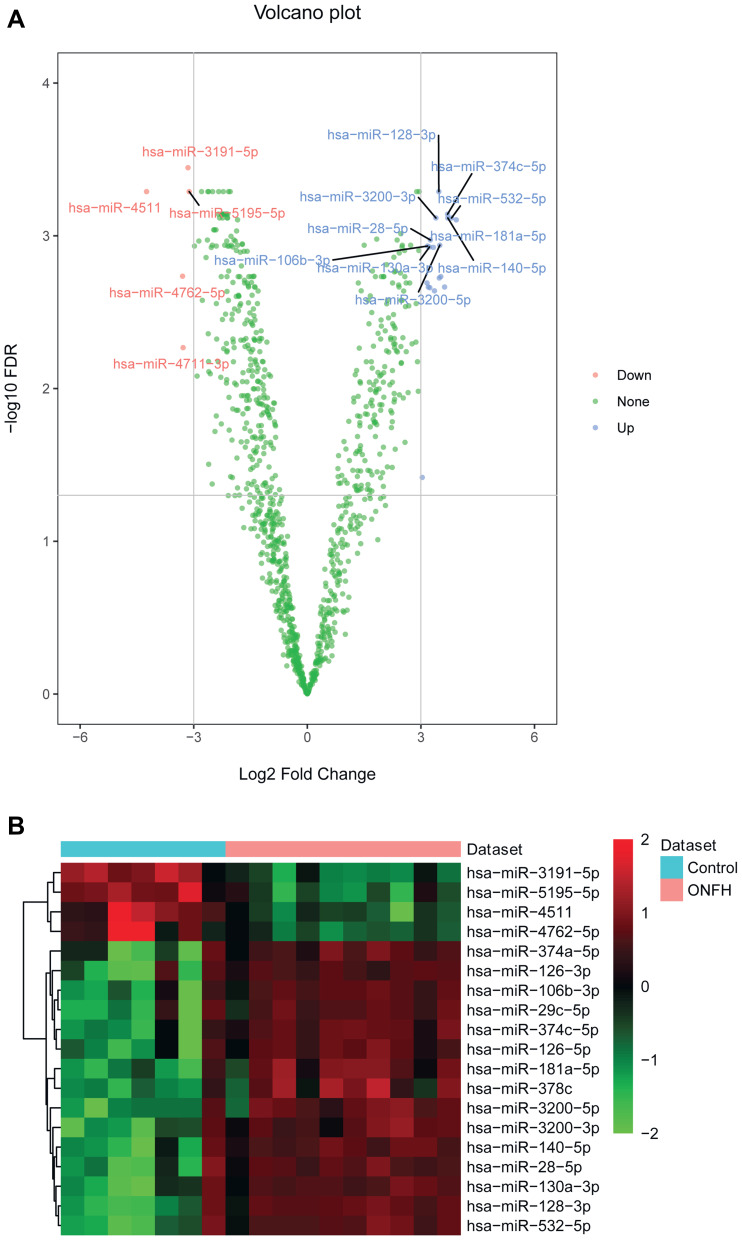
Figure 1.
The volcano plot and heat map of all differentially expressed miRNAs in osteonecrosis of the femoral head. (A) The volcano plot of all differentially expressed miRNAs. The X and Y axis represents Log2 Fold Change and –log10 FDR, respectively. Blue and red represents up-regulated and down-regulated miRNAs, respectively. (B) The heat map of all differentially expressed miRNAs.
Abbreviation: ONFH, osteonecrosis of the femoral head.

