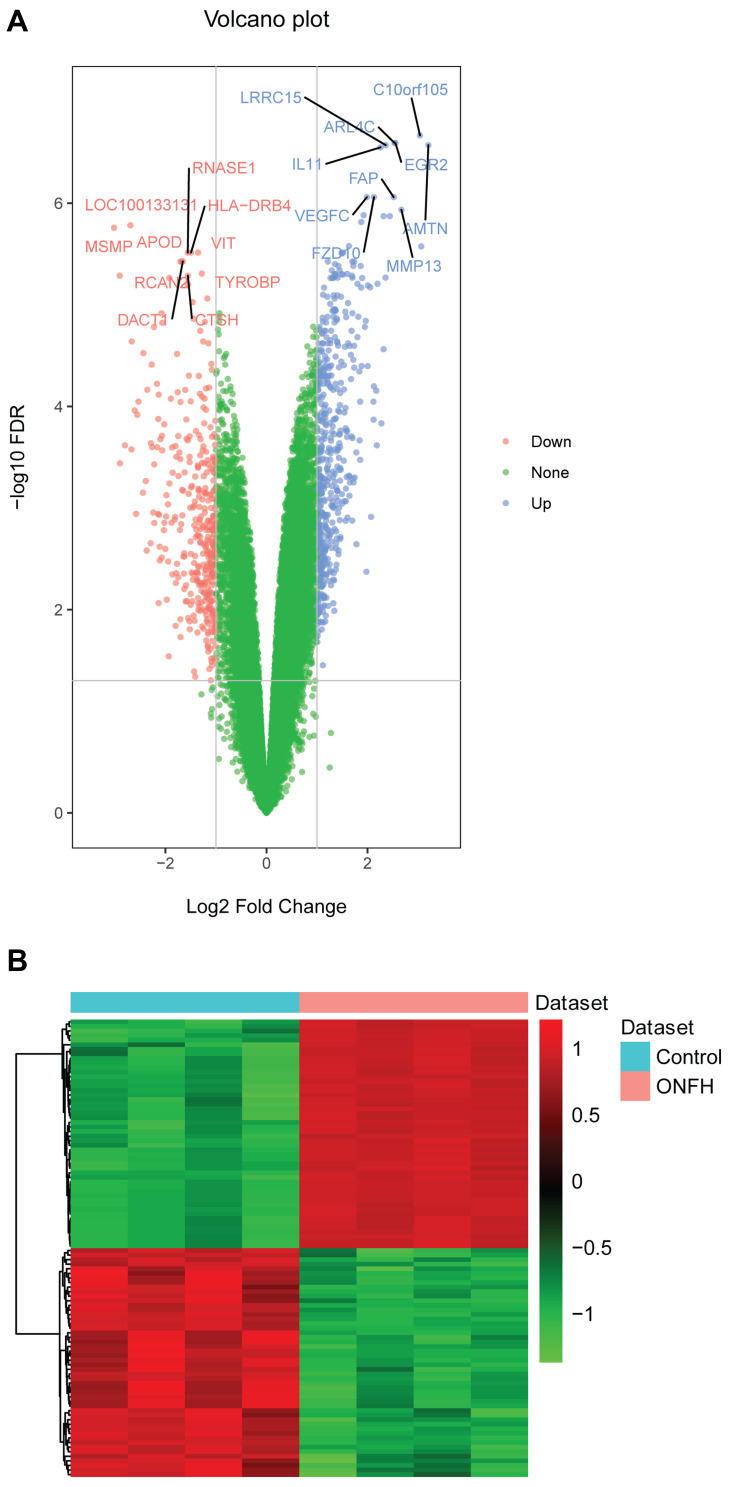
Figure 2.
The volcano plot and heat map of the top 100 differentially expressed mRNAs in osteonecrosis of the femoral head. (A) The volcano plot of the top 100 differentially expressed mRNAs. The X- and Y-axes represent Log2 Fold Change and –log10 FDR, respectively. Blue and red represent up-regulated and down-regulated mRNAs, respectively. (B) The heat map of the top 100 differentially expressed mRNAs.
Abbreviation: ONFH, osteonecrosis of the femoral head.

