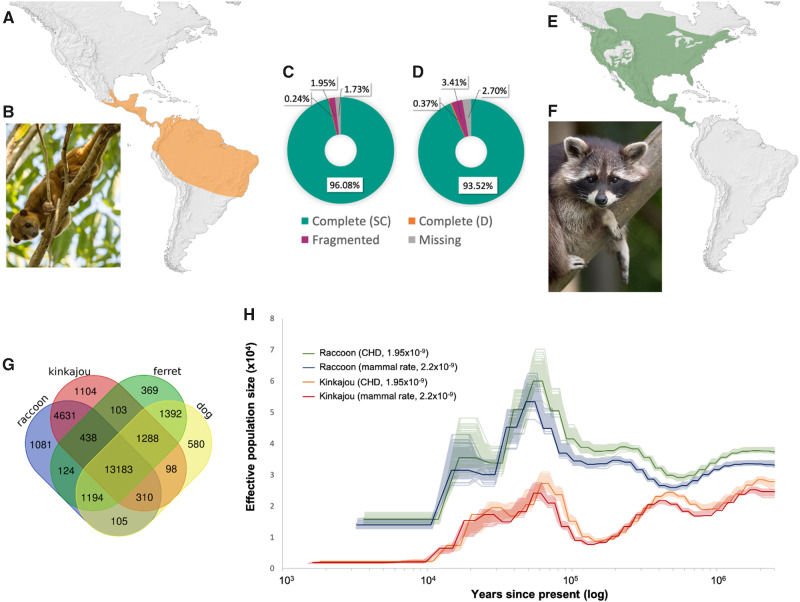
Fig. 1.
(A) Kinkajou range distribution. (B) Image of a kinkajou, Potos flavus (Photo by Wim Hoek ©). (C) BUSCO results for the kinkajou genome. (D) BUSCO results for the raccoon genome. BUSCO legend: SC, single copy; D, duplicate. (E) Northern raccoon range distribution. (F) Image of a northern raccoon, Procyon lotor (Photo by Bernard Landgraf, Wikimedia Creative Commons). (G) Venn diagram depicting a comparison of orthogroups identified in each species by Orthofinder. (H) Effective population size reconstruction estimated with PSMC for both species, using two different mutation rates (see legend).

