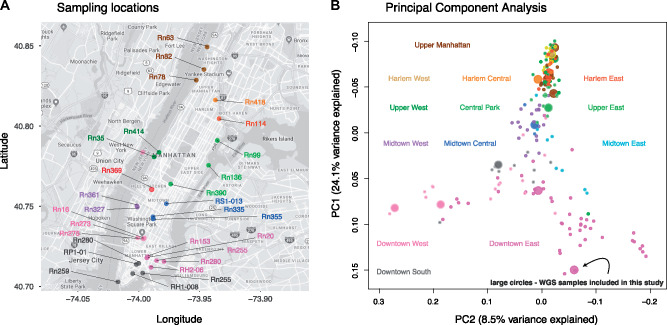
Fig. 1.
Sampling locations and genetic population structure of NYC brown rats. (A) Sampling sites of the 29 rat whole-genome samples used in our selection scans. Color coding corresponds to NYC neighborhoods as in panel (B). (B) Principal component analysis of 198 rats reanalyzed from Combs, Puckett, et al. (2018), with the 15 rats included in both Combs, Puckett, et al. (2018) and this study represented by large circles. In both panels, color coding corresponds to NYC neighborhoods.

