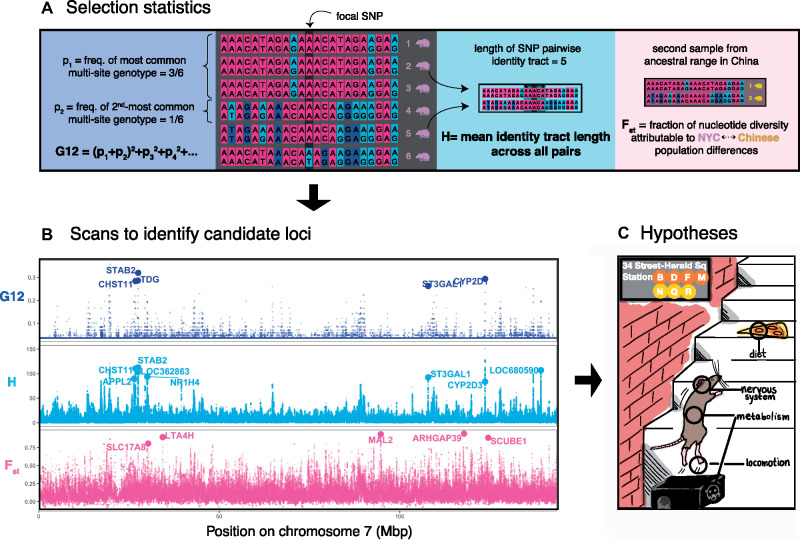
Fig. 2.
Scanning for signals of adaptation. (A) Three selection statistics were used to identify signals of selection. Two of the statistics, G12 and H-scan, detect loci with low haplotype diversity (high homogeneity)—a signature of recent or ongoing selective sweeps. G12 is defined similarly to the homozygosity of multisite genotypes (in a window of a fixed number of SNPs)—a sum of squared frequencies of multisite genotypes—except that the two most frequent genotypes are grouped (summed and squared) together. In the illustrated example, the most common multisite genotype is shared by rats 1–3. The second-most common genotype is only carried by one rat. H is the mean length of the maximal pairwise identity tract containing the focal SNP—where the mean is taken across all pairs in the sample. In the illustrated example, the tract is five SNPs long for rats 2 and 5. Finally, Fst was used to measure genetic differentiation between the NYC sample and a sample from the presumed ancestral range of brown rats in northeast China. Extreme differentiation at a locus may also be indicative of selection since the populations’ split. (B) Values of the three statistics along chromosome 7. G12 and H-scan peak at similar regions of the genome, suggesting that both statistics pick up on similar signals of frequent, long segregating haplotypes. Large circles denote the locations of candidates: top-scoring loci that are also <20 kb away from protein-coding genes (names of the corresponding genes are noted). Corresponding plots for all other autosomes can be found in supplementary file S1, Supplementary Material online. (C) Biological functions associated with candidate genes may point to traits that have been subject to selection in NYC rats, including diet, the nervous system, metabolism, and locomotion.

