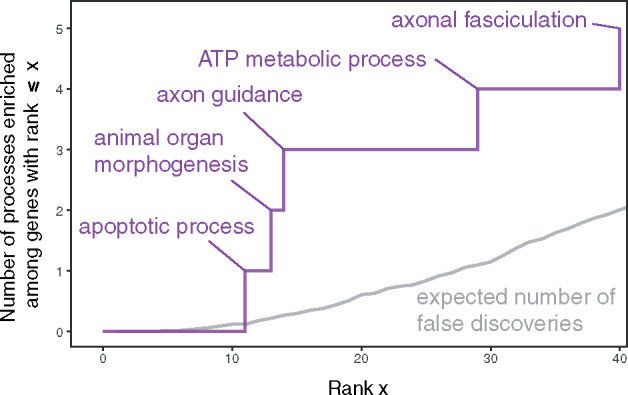
Fig. 4.

Biological processes enriched among 40 top-scoring genes. This figure focuses on candidate targets of adaptation arising from a comparison of G12 values in genes. Each gene was given the maximum score of all focal SNPs in the gene, and genes were ranked by this maximal score. We consider GO biological processes associated with at least three top-scoring genes as enriched, and the y axis shows their cumulative count. Purple text labels show GO biological processes associated with exactly three of the (x value) top-scoring genes. The gray line shows the expected number of false (biological process) discoveries among the top x candidates, estimated based on permutations of gene scores.
