Figure 3.

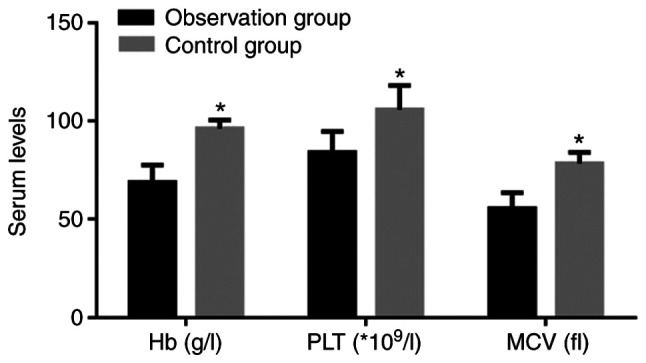
Levels of Hb, PLT and MCV. Values are expressed as the mean ± standard deviation and were analyzed by Student's t-test. *P<0.05, compared with the observation group. Hb, hemoglobin; PLT, platelets; MCV, mean corpuscular volume.

Levels of Hb, PLT and MCV. Values are expressed as the mean ± standard deviation and were analyzed by Student's t-test. *P<0.05, compared with the observation group. Hb, hemoglobin; PLT, platelets; MCV, mean corpuscular volume.