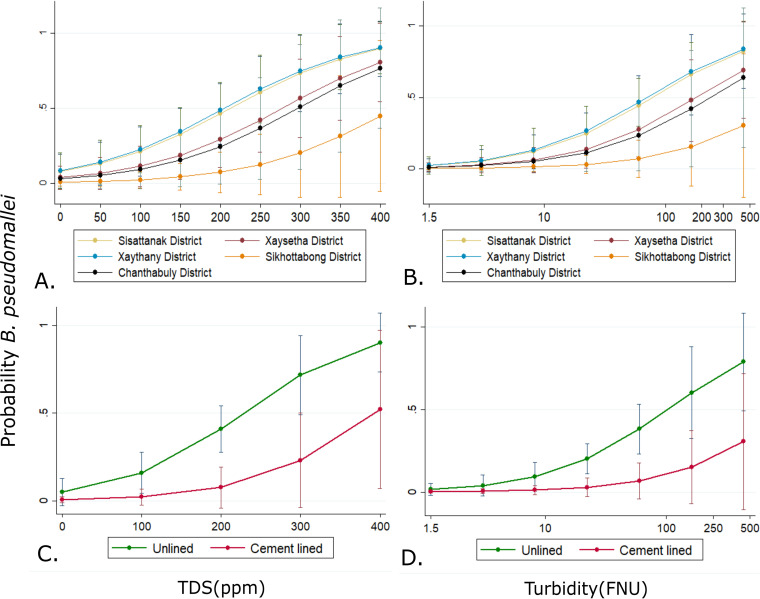
FIG 2.
Generalized estimated equation (GEE) margins plots of adjusted predicted probabilities of B. pseudomallei occurrence with all other variables in the model held constant. Shown are predicted probabilities as a function of increased water TDS (A) in each of the districts surveyed and turbidity (B) or probabilities in unlined or cement-lined drains based on TDS (C) or turbidity of water sample (D). Bars indicate 95% confidence intervals (CIs).

