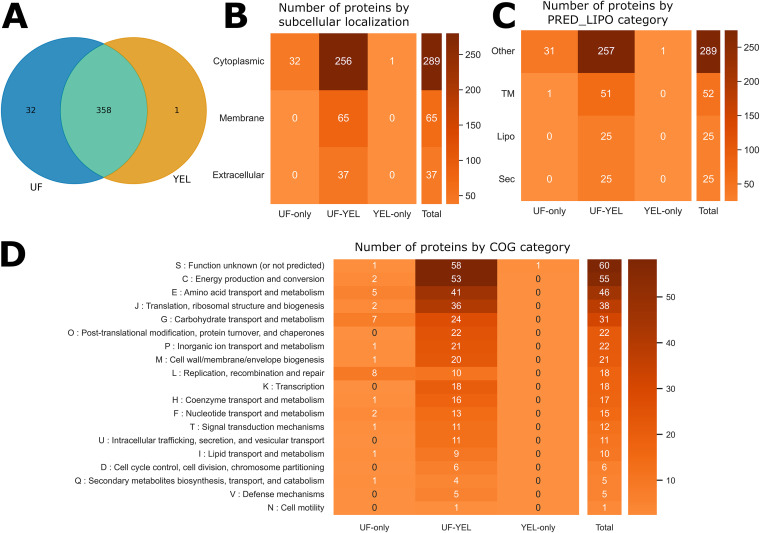
FIG 3.
Qualitative proteomics can reveal differences in EV protein content as a function of growth conditions. (A) Venn diagram showing the number of shared and specific proteins for EVs under the two growth conditions. (B to D) Heatmaps showing the distribution of proteins as a function of growth condition categories and functional predictions. Columns show growth condition categories (UF-only, proteins identified exclusively in UF-derived EVs; YEL-only, proteins identified exclusively in YEL-derived EVs; UF-YEL, proteins identified under both growth conditions). Rows show subcellular localization prediction (cytoplasmic, membrane, or extracellular) (B), PRED-LIPO prediction (Sec, secretion signal peptide; Lipo, lipoprotein signal peptide; TM, transmembrane; Other, no signals found) (C), and COG functional categories (D).

