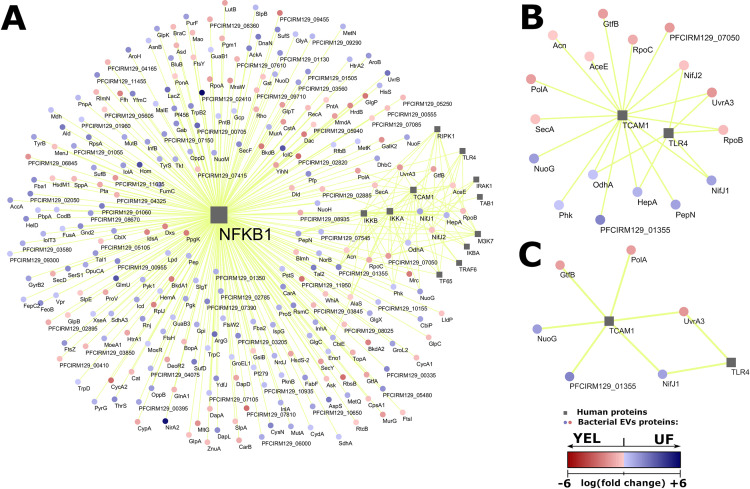
FIG 5.
Prediction of protein-protein interactions highlights relevant bacterial proteins. (A to C) A network representation of predicted interactions filtered by human proteins that correspond to the LPS-induced part of the NF-κB pathway (A), by uman proteins involved in the LPS-induced NF-κB pathway but not in induction by TNF-α or IL-1β (B), and by bacterial proteins whose abundance was considered significant by quantitative proteomic analysis (C). Human proteins are represented by gray squares, and bacterial proteins are represented by red or blue circles. Predictions of interactions are represented by yellow lines connecting squares and circles. The relative abundance of bacterial proteins is seen according to the scale in the bottom right corner (logarithm of fold change), where positive values (blue) indicate a higher abundance in UF-derived EVs and negative values (red) indicate a higher abundance in YEL-derived EVs.

