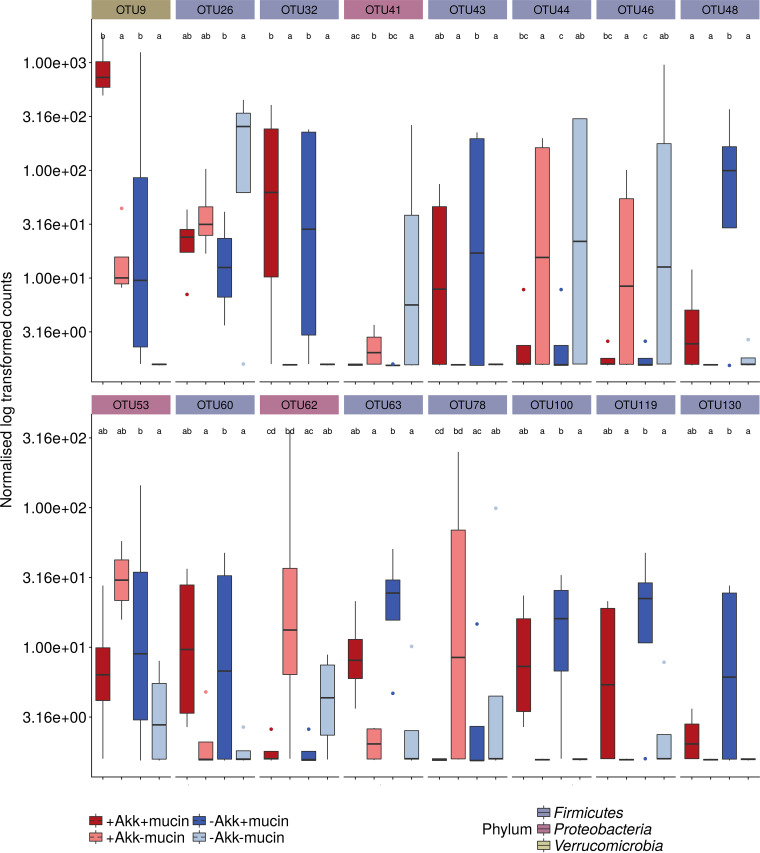
FIG 6.
Boxplots of OTUs that were significantly different in abundance between treatments (day 20) across all four donors as determined by DESeq2 analysis (α = 0.05). The color of the boxplots represents the different treatments, and facet labels are colored according to the phylum-level classification. Letter codes show significance.

