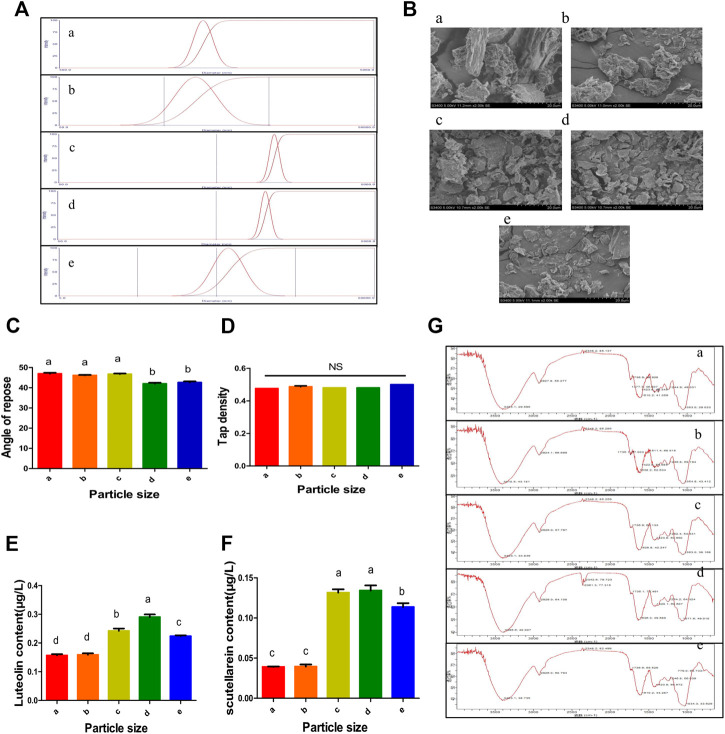
FIGURE 5.
Evaluation of different characteristics of PSP. (A) The particle of different PSPs was determined by laser diffraction instrument. α-ε represents the particle size distributions of five different kinds of PSPs, respectively. (B) Different sized PSP powders were observed by 2,000× SEM. The particle size of PSP was gradually decreased from α to ε. (C,D) The angle of repose and tap density of different particles of PSP were determined. (E,F) The content of luteolin and scutellarein. (G) The PSP with different particles was determined through Fourier infrared spectroscopy. The numbers in the picture represent the peak absorption of each functional group in the PSP. All data are presented as means ± SD from five groups. Different small letter superscripts (a–e) in the same column indicate significant differences at p < 0.05.

