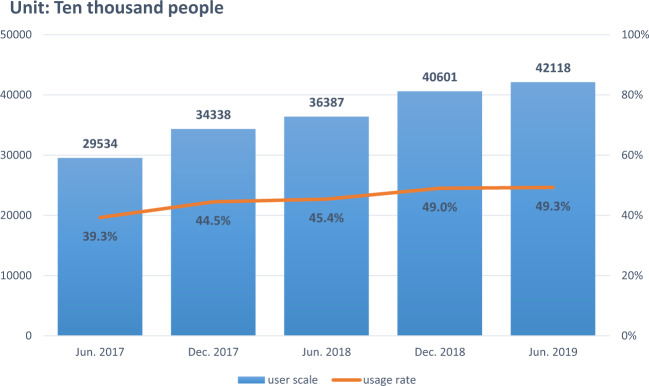
Fig. 1. 2017–2019 O2O food delivery customer population in China.
The figure demonstrates the increase in the customer number of O2O food delivery system between 2017 and 2019. The user scale is the total number of O2O service users in China for each time point (unit: ten thousand people). The usage rate shows the percentage of user amont in each time point (100% = 500 million) in order to show the increase of users across these years. Data retrieved from the 44th Statistical report on the development of China Internet network by China Internet Network Information Center (CNNIC) in 2019. Available from: http://www.cac.gov.cn/2019-08/30/c_1124938750.htm.

