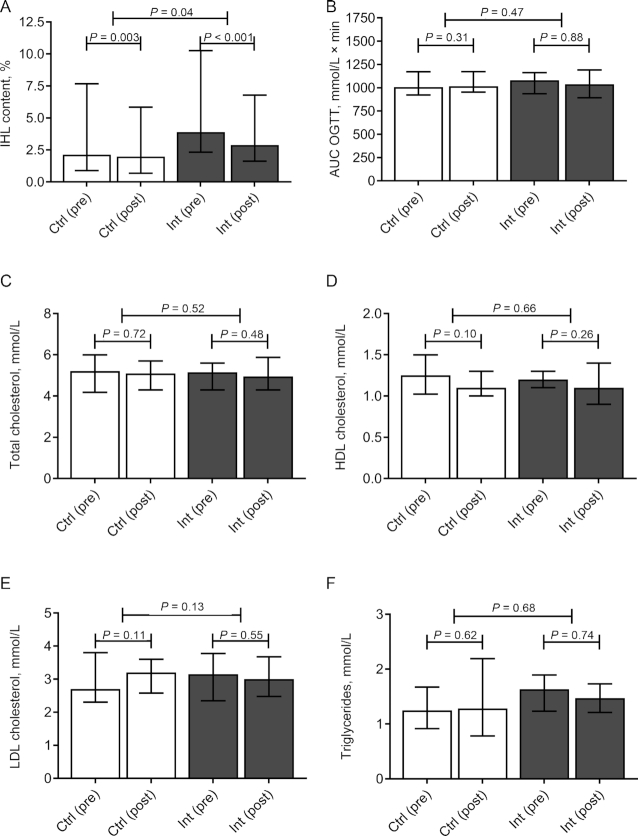
FIGURE 3.
IHL content, glucose tolerance, and serum lipid concentrations. (A) IHL content, (B) glucose AUC during an OGTT, (C) serum total cholesterol, (D) serum HDL cholesterol, (E) serum LDL cholesterol, and (F) serum triglycerides in Ctrl (white bars, n = 21) and Int (grey bars, n = 16) at baseline (pre) and after completion of the study (post). Data are expressed as median ± IQR. Differences within groups are analyzed with Wilcoxon's Signed Rank test. Differences between groups are analyzed with a Mann–Whitney U test. Ctrl, control group; IHL, intrahepatic lipid; Int, intervention group; OGTT, oral-glucose-tolerance test.

