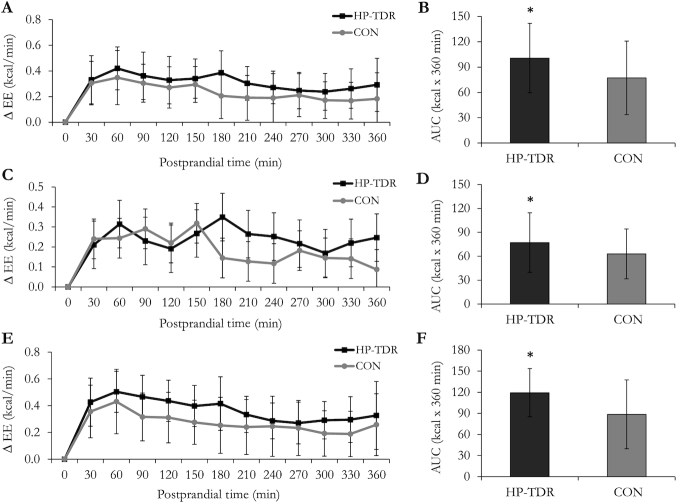
FIGURE 3.
Change in resting energy expenditure (∆ EE) following ingestion of the isocaloric HP-TDR and CON breakfasts on the second day of intervention while participants were inside the whole-body calorimetry unit. Values are mean ± SD. Left panels (A, C, and E) indicate 30-min means; right panels (B, D, and F) indicate the total AUC over 360 minutes. Top panels (A and B) contain data from all participants (n = 43); middle panels (C and D) contain data from females (n = 19); and bottom panels (E and F) contain data from males (n = 24). *Significant difference between the HP-TDR and CON conditions, P <0.05 as assessed by a mixed ANOVA. Although there was no statistically significant interaction between the interventions and sex on the total AUC (P = 0.115), the main effect of sex showed a significant difference in females and males (P = 0.003), as assessed by a mixed analysis of variance. CON, control; HP-TDR, high-protein total diet replacement.

