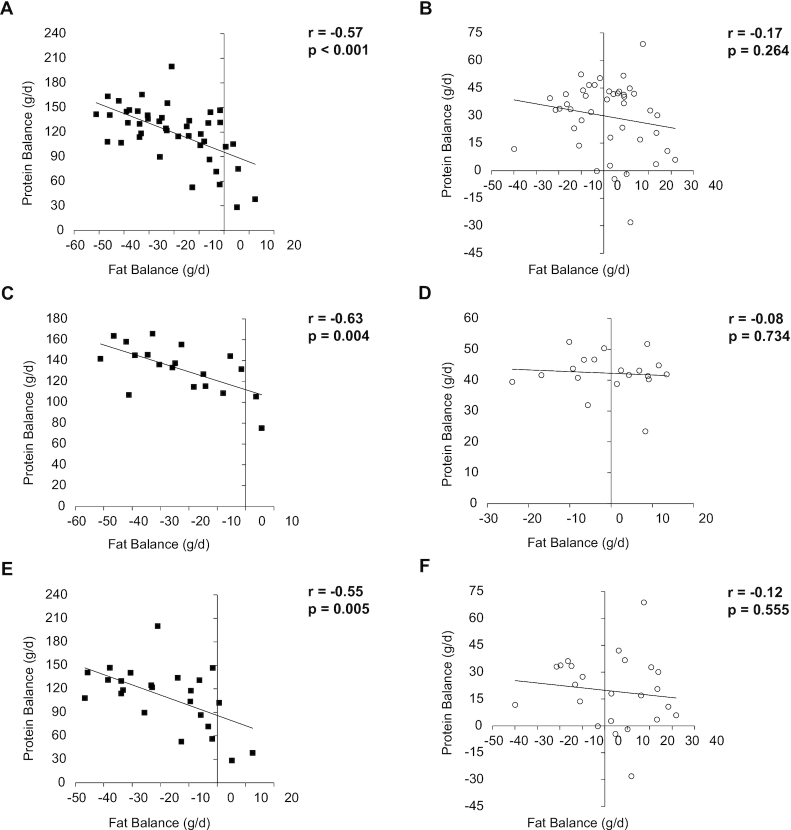
FIGURE 4.
Correlation between protein and fat balances in all participants (n = 43, panels A and B), females (n = 19, panels C and D), and males (n = 24, panels E and F). Black squares (▓) represent the HP-TDR condition and empty circles (○) represent the CON condition. CON, control, HP-TDR, high-protein total diet replacement.

