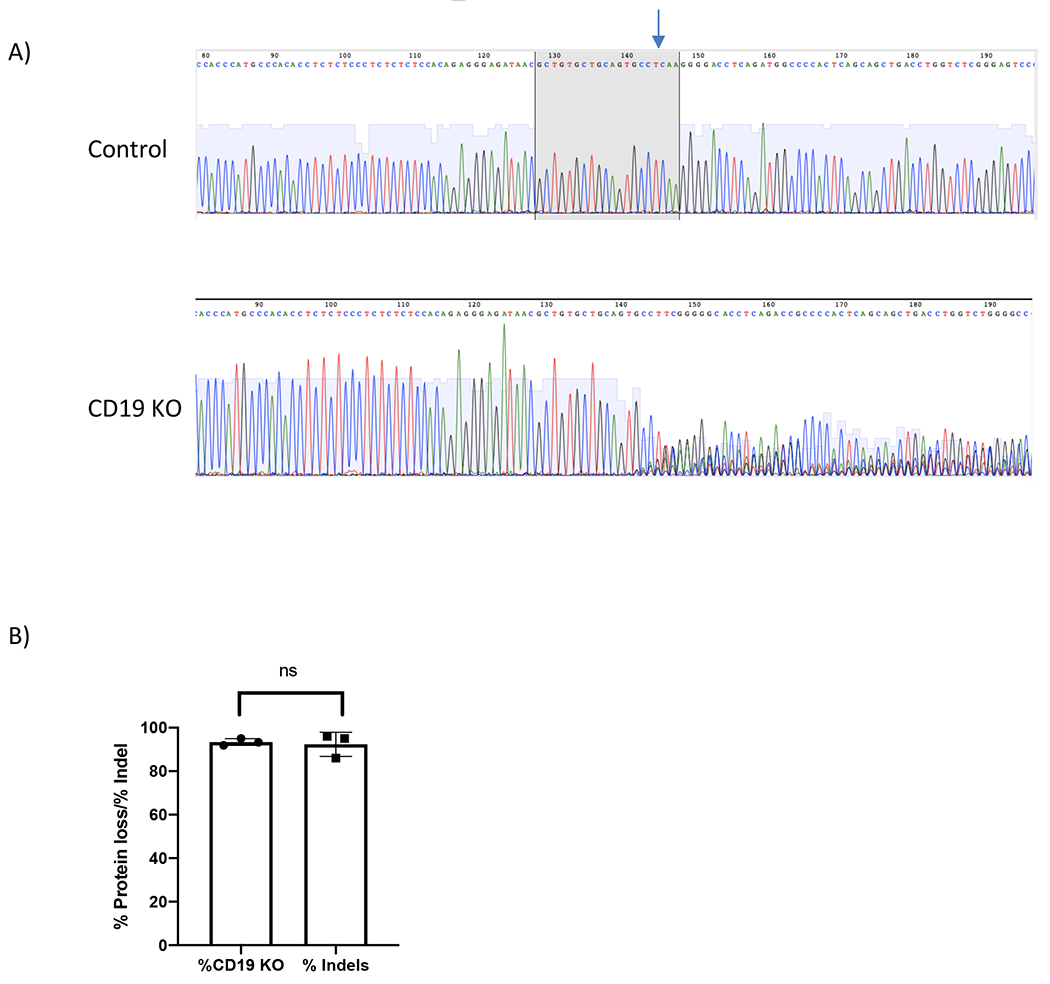
Figure 3. CD19 protein loss vs indel formation.

(A) Chromatograms depict sequencing peaks of control and CD19 KO sample. Gray box on the control peaks highlights the target sequence of CD19 gRNA with the predicted cut site indicated (blue arrow). CD19 KO showed “double peaks” sequencing around the predicted cut site. (B) Bar graph showing consistent results between % CD19 protein loss and % indels formation at CD19 locus (p≥0.05).
