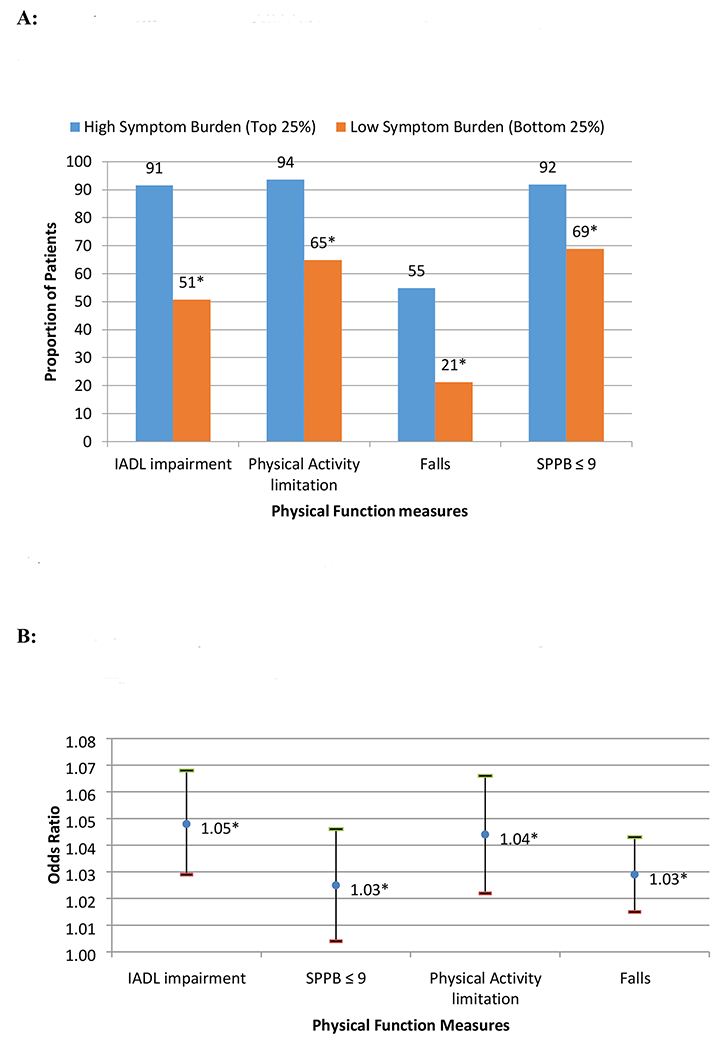
Figure 1 –

A. Physical function impairments by highest versus lowest quartile of symptom burden scores. *All test of proportions p-values <0.05. B. Multivariate analyses showing associations between symptom burden and physical function impairment measures. Covariates in each regression models: Age, Gender, Race, Marital Status, Education, Depression, Comorbidity, Cancer types, and Cancer Stage. *p-value < 0.05
