
FIGURE 5.
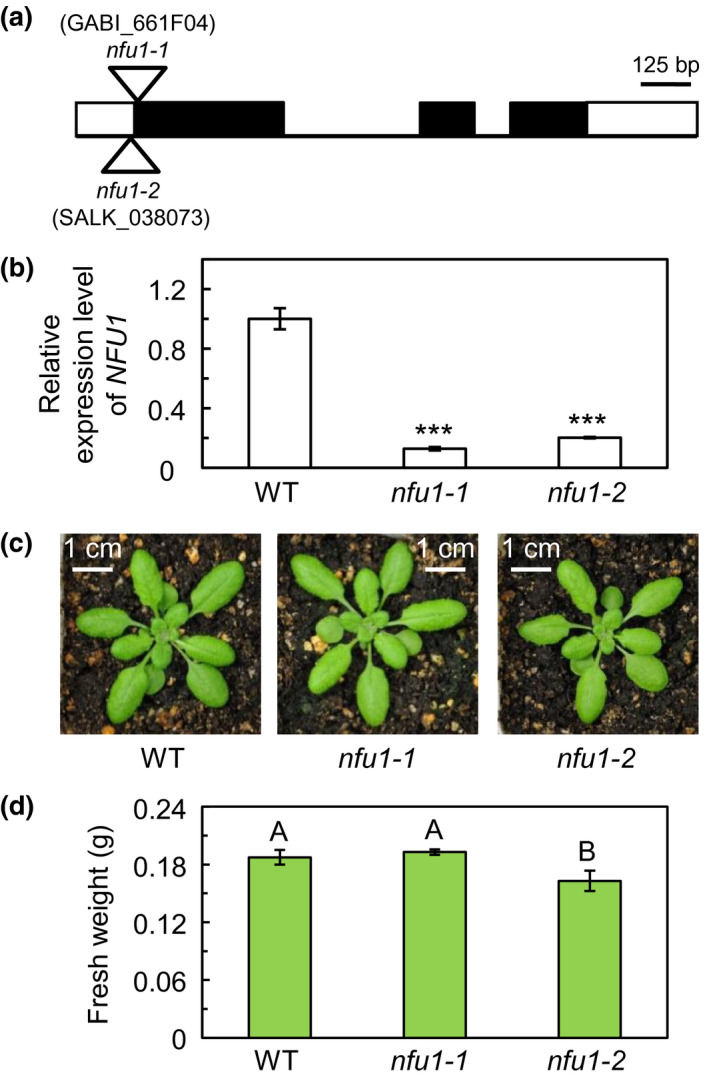
Identification and phenotypic characterization of the nfu1‐1 and nfu1‐2 mutants. (a) Structure of the NFU1 gene and locations of the nfu1‐1 and nfu1‐2 mutations. White boxes represent the untranslated regions; black boxes represent exons; and lines represent introns. The T‐DNA insertions in the nfu1‐1 and nfu1‐2 mutants are represented by triangles. bp, base pair. (b) Relative expression level of NFU1 determined by quantitative RT‐PCR in 4‐week‐old plants. The transcript level of NFU1 was normalized by the transcript level of ACT2 (At3g18780). The values (mean ± SE, n = 5) are given as ratios to the transcript level of NFU1 in the wild type. Asterisks indicate significant differences between the mutant and the wild type (WT; Student's t test; *, p < .05; **, p < .01; ***, p < .001). (c) Images of 4‐week‐old plants grown on a 12‐hr light/12‐hr dark photoperiod with an irradiance of 150 μmol photons m−2 s−1 during the light period. WT, wild type. (d) Fresh weight of the above‐ground portions of 4‐week‐old plants. Values are presented as mean ± SE (n = 7). Values not connected by the same upper‐case letter are significantly different (Student's t test, p < .05)