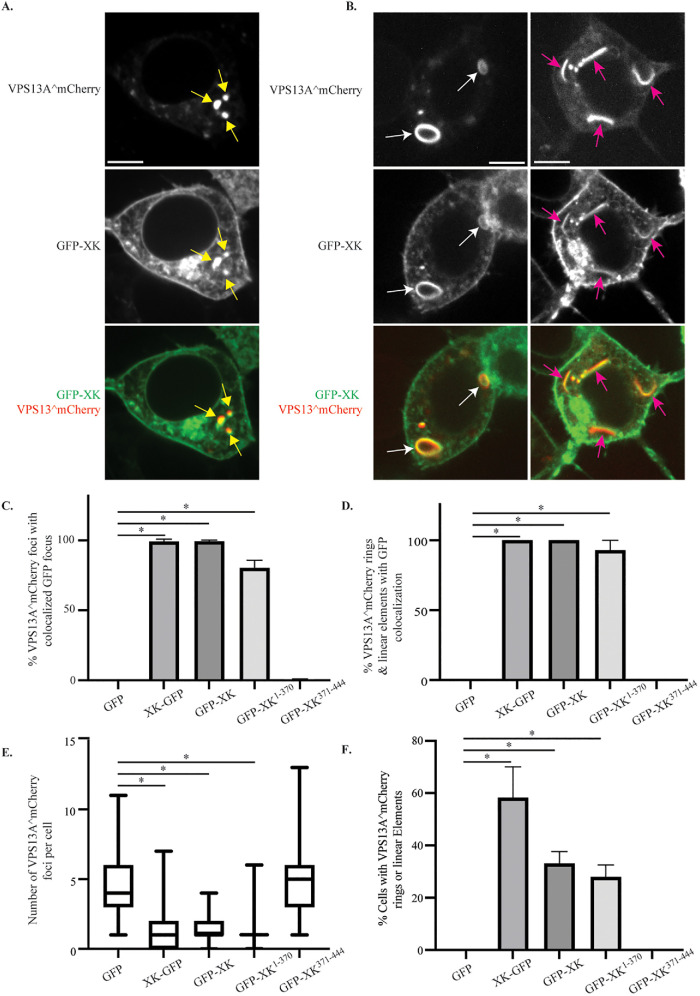
FIGURE 4:
Colocalization of GFP-XK and VPS13A^mCherry in human cells. HEK293T cells were transfected with plasmids expressing VPS13A^mCherry and various versions of GFP-XK as indicated. (A) Representative cell showing colocalization of GFP-XK and VPS13A^mCherry in cytoplasmic foci (yellow arrows). Scale bar = 10 μm. (B) Representative cell showing GFP-XK and VPS13A^mCherry colocalization in ringlike structures (white arrows) and linear elements (pink arrows). (C) Quantification of VPS13A^mCherry colocalization in foci containing various GFP-XK proteins. Data are the average of at least three experiments with more than 25 foci scored in each experiment. Asterisks indicate p value < 0.00002 by unpaired t test. In graphs C–F, error bars represent one SD. (D) Quantification of VPS13A^mCherry/GFP-XK colocalization in rings and linear elements. Data are the average of three or more experiments with at least 20 cells scored in each experiment and at least 20 total rings or linear elements scored for the XK-GFP, GFP-XK, and GFP-XK1-370 constructs. *p < 0.0001 by one-way ANOVA with Dunnett’s test. (E) The number of VPS13A^mCherry foci per cell in cells coexpressing either GFP alone or the indicated GFP-XK fusions. Data are the average of at least three experiments with more than 25 foci scored for each construct in each experiment. At least 101 total foci scored for each construct. Horizontal lines indicate median values, boxes represent three quartiles, and whiskers indicate the range of values. *p < 0.0001 by unpaired t test. (F) The fraction of cells displaying rings or lines of VPS13A^mCherry fluorescence when coexpressing different GFP constructs. The fraction of cells displaying at least one ring or linear element is shown. Values are averages of three independent experiments with at least 19 cells scored per experiment. *p < 0.0005, unpaired t test

