FIGURE 1:
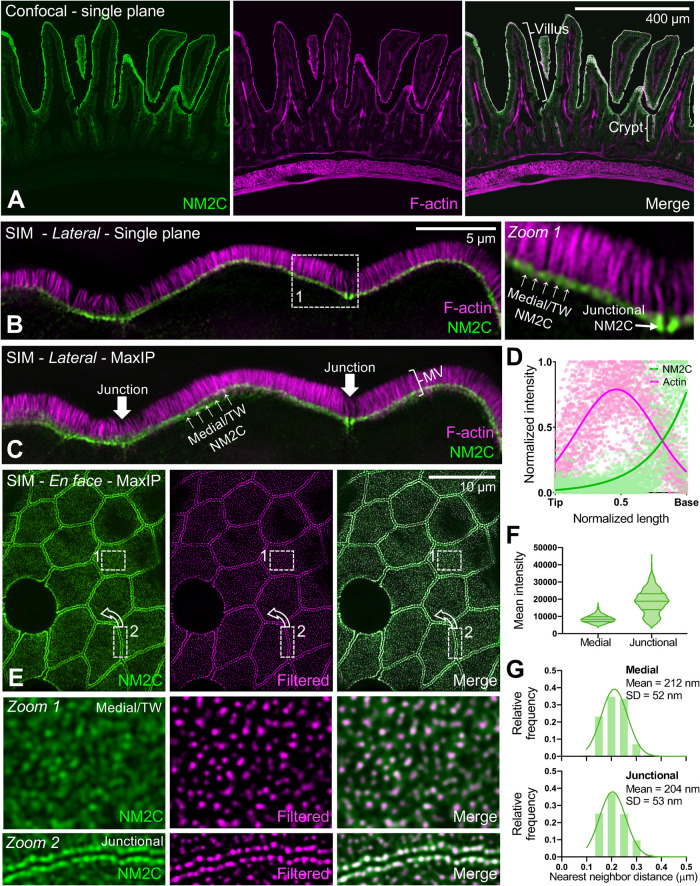
NM2C localizes to the enterocyte terminal web. (A) Single-plane confocal microscopy of small intestinal tissue from a mouse endogenously expressing EGFP-NM2C (green), costained with phalliodin-568 to visualize F-actin (magenta). Representative villus and crypt regions are highlighted by brackets in merge panel. (B) Single-plane SIM image of small intestinal tissue from a mouse endogenously expressing EGFP-NM2C (green), co-stained with phalloidin-568 to visualize F-actin (magenta). Zoom 1 shows region bound by the dashed white box; medial and junctional populations are highlighted. (C) Maximum intensity projection (MaxIP) of lateral view shown in B. (D) Normalized intensity plots of NM2C and F-signals taken from line scans drawn parallel to the microvillar axis (n = 45) reveal enrichment of NM2C at the base of microvilli in the terminal web. (E) En face SIM MaxIP images of small intestinal tissue from a mouse endogenously expressing EGFP-NM2C (green); medial/terminal web and junctional populations are highlighted in zooms 1 and 2, respectively. SIM image (left) is shown in parallel with a radiality map that was calculated using NanoF-SRRF (middle), which accentuated intensity peaks from individual NM2C puncta and allowed for more precise localization of their position. Merge image (right) shows composite of the original SIM image with the SRRF-filtered image. (F) Mean intensity of medial/terminal web vs. junctional NM2C puncta from SIM images. (G) Histograms of nearest neighbor distances generated by localizing medial (top) vs. junctional (bottom) NM2C puncta in SRRF-filtered SIM images. For F and G, n = 2480 medial puncta and n = 1019 junctional puncta. Scale is indicated on individual image panels.

