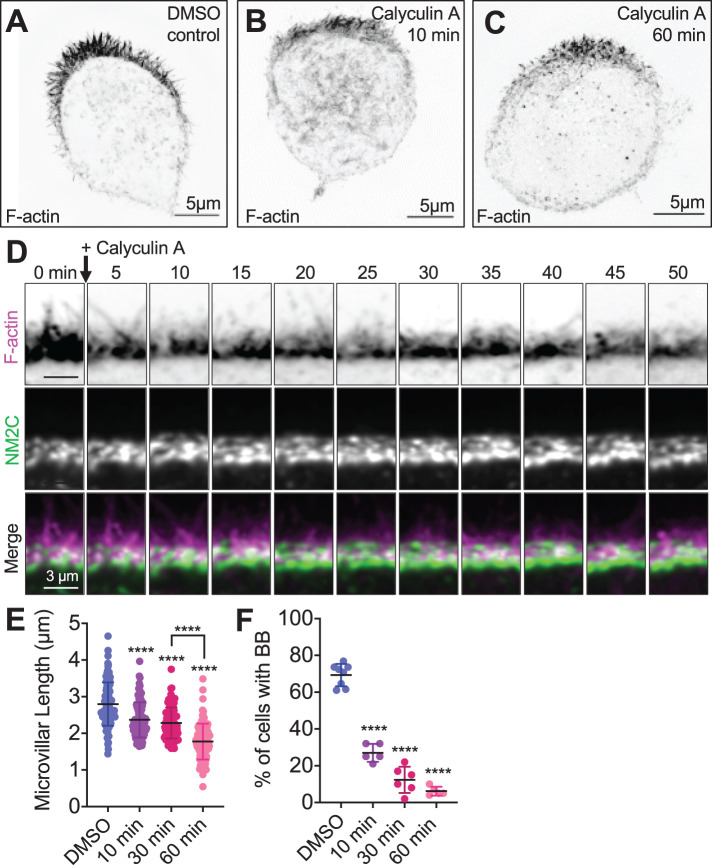
FIGURE 3:
Activation of NM2 shortens epithelial microvilli. SIM MaxIP images of representative phalloidin-stained (F-actin) Ls174T-W4 cells fixed after (A) 60 min exposure to dimethyl sulfoxide (DMSO) vehicle control, (B) 10 min exposure to 4 nM calyculin A, or (C) 60 min exposure to 4 nM calyculin A; signals are inverted to facilitate visualization of dim structures. (D) Image montage from spinning-disk confocal time-lapse data shows the impact of calyculin A treatment on apical microvilli in a Ls174T-W4 cell–expressing F-actin probe EGFP-UtrCH (magenta) with Halo-NM2C (green) labeled with JF585. (E) Quantification of microvillar length in Ls174T-W4 cells fixed after 10, 30, and 60 min in 4 nM calyculin A; each data point is a single microvillus, at least 10 microvilli per cell, minimum of 10 cells per condition. (F) Quantification of the percentage of brush border–positive cells as a function of time in calyculin A. Each data point is the percentage of cells with a brush border in a stitched 5 × 5 40× image. Each data point is the percentage of cells with a brush border in a stitched 5 × 5 40× image. Data in E and F were tested using ordinary one-way ANOVA with Dunnett’s multiple comparisons; ****, p < 0.000 vs. DMSO-negative controls unless overwise noted.

