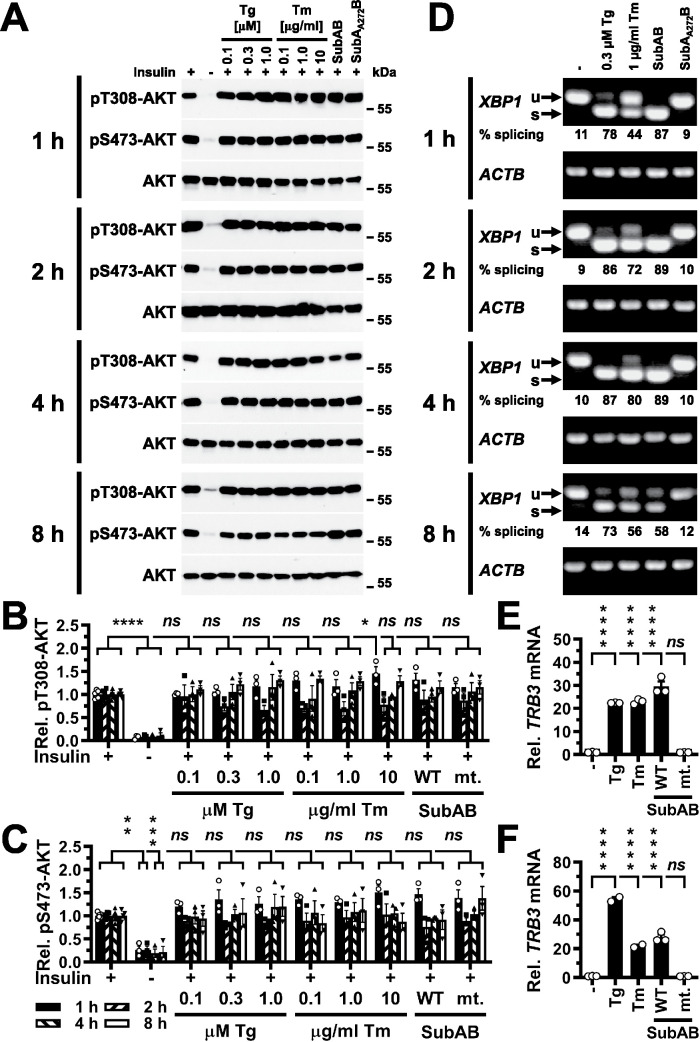
FIGURE 1:
Acute ER stress does not inhibit phosphorylation of AKT on T308 or S473 in C2C12 myotubes stimulated with 100 nM insulin for 15 min. (A) C2C12 myotubes were serum-starved for 18 h and treated with the indicated concentrations of thapsigargin (Tg), tunicamycin (Tm), 1 μg/ml SubAB, or 1 μg/ml catalytically inactive SubAA272B during the last 1–8 h of serum starvation and then stimulated with 100 nM insulin for 15 min where indicated. Cell lysates were analyzed by Western blotting. Quantification of phosphorylation of AKT on (B) T308 and (C) S473. Bars represent SEs (n = 5 for S473 phosphorylation of AKT at 8 h in unstressed, insulin-stimulated cells, n = 6 for all other unstressed, insulin-stimulated samples, and n = 3 for all other treatments). p values for comparison of ER-stressed samples and samples not stimulated with 100 nM insulin to samples stimulated with 100 nM insulin were calculated by ordinary two-way ANOVA with Dunnett’s multiple comparisons test (Dunnett, 1955, 1964). (D) Detection of XBP1 splicing by reverse transcriptase PCR. PCR products derived from unspliced (u) and spliced (s) XBP1 mRNA are indicated by arrows. β-Actin (ACTB) was used as a loading control. (E, F) Induction of TRB3 in C2C12 cells by ER stress. C2C12 cells were treated with 300 nM thapsigargin, 1 μg/ml tunicamycin, 1 μg/ml SubAB (labeled “WT”), or 1 μg/ml SubAA272B (labeled “mt.”) for (E) 4 h and (F) 8 h. TRB3 mRNA levels were determined by reverse transcriptase-qPCR and standardized to the loading control ACTB. Bars represent SEs (n = 2 for the samples treated with thapsigargin or tunicamycin for 8 h, n = 3 for all other samples). p values for comparison of treated samples to the untreated sample (“–” ) were calculated by ordinary two-way ANOVA with Dunnett’s multiple comparisons test taking data shown in Figure 10F into account. Abbreviations in this and all other figures: ns, not significant, * or #, p < 0.05, ** or ##, p < 0.01, *** or ###, p < 0.001, and **** or ####, p < 0.0001.

