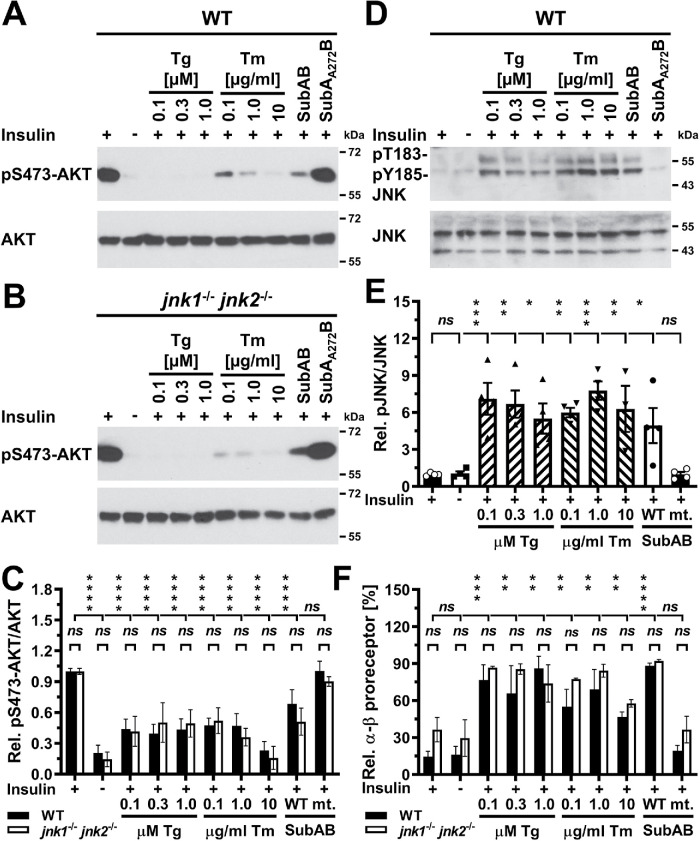
FIGURE 12:
JNK1 and JNK2 are not required for development of insulin resistance in ER-stressed cells. (A) Serum-starved WT and (B) jnk1–/– jnk2–/– MEFs were treated for 24 h with the indicated concentrations of thapsigargin, tunicamycin, 1 μg/ml SubAB, or 1 μg/ml SubAA272B before stimulation with 100 nM insulin for 15 min. (C) Quantification of phosphorylation of AKT on S473 relative to total AKT levels in WT and jnk1–/– jnk2–/– MEFs exposed to thapsigargin, tunicamycin, and 1 μg/ml SubAB or 1 µg/ml SubAA272B. Bars represent SEs (n = 12 for unstressed, insulin-stimulated WT MEFs, n = 10 for unstressed, insulin-stimulated jnk1–/– jnk2–/– MEFs, n = 6 for all other samples for WT MEFs, and n = 5 for all other samples for jnk1–/– jnk2–/– MEFs). p values for comparison of the relative AKT S473 phosphorylation between WT and jnk1–/– jnk2–/– MEFs were calculated using ordinary two-way ANOVA with Šidák’s correction for multiple comparisons. p values for comparison of ER-stressed samples and samples not stimulated with 100 nM insulin to samples stimulated with 100 nM insulin were calculated using ordinary two-way ANOVA with Dunnett’s multiple comparisons test. (D) Activation of JNK in serum-starved WT MEFs exposed to the indicated concentrations of thapsigargin or tunicamycin, 1 μg/ml SubAB, or 1 µg/ml SubAA272B for 24 h before stimulation with 100 nM insulin for 15 min. (E) Quantification of the Western blots in panel D. Bars represent SEs (n = 8 for insulin-stimulated cells, n = 4 for all other samples). p values for comparison of ER-stressed samples and samples not stimulated with 100 nM insulin to samples stimulated with 100 nM insulin were calculated using ordinary one-way ANOVA with Dunnett’s multiple comparisons test. (F) JNK deficiency does not protect from the effects of ER stress on insulin receptor processing in the secretory pathway. The relative abundance of α-β proreceptors was determined by Western blotting of lysates of serum-starved WT and jnk1–/– jnk2–/– MEFs exposed for 24 h to the indicated concentrations of thapsigargin and tunicamycin and 1 μg/ml SubAB or 1 µg/ml SubAA272B followed by stimulation with 100 nM insulin for 15 min where indicated. Bars represent SEs (n = 4 for unstressed, insulin-stimulated cells, n = 2 for all other samples). p values for comparison of the relative abundance of α-β proreceptors between WT and jnk1–/– jnk2–/– MEFs were calculated by Welch’s test (Welch, 1947) followed by a Games–Howell post hoc test (Games and Howell, 1976). p values for comparisons of treatments were calculated by ordinary two-way ANOVA with Dunnett’s multiple comparisons test.

